Gå til hovedinnhold
Havforskningsinstituttet
HI
English
<- Tilbake
Søk
Søk
Søk
View page in English
Figur
Fra rapporten:
Report on evaluation of harvest rules for Barents Sea capelin in subareas 1 and 2 (northeast arctic), excluding division 2.a west of 5°W - full report
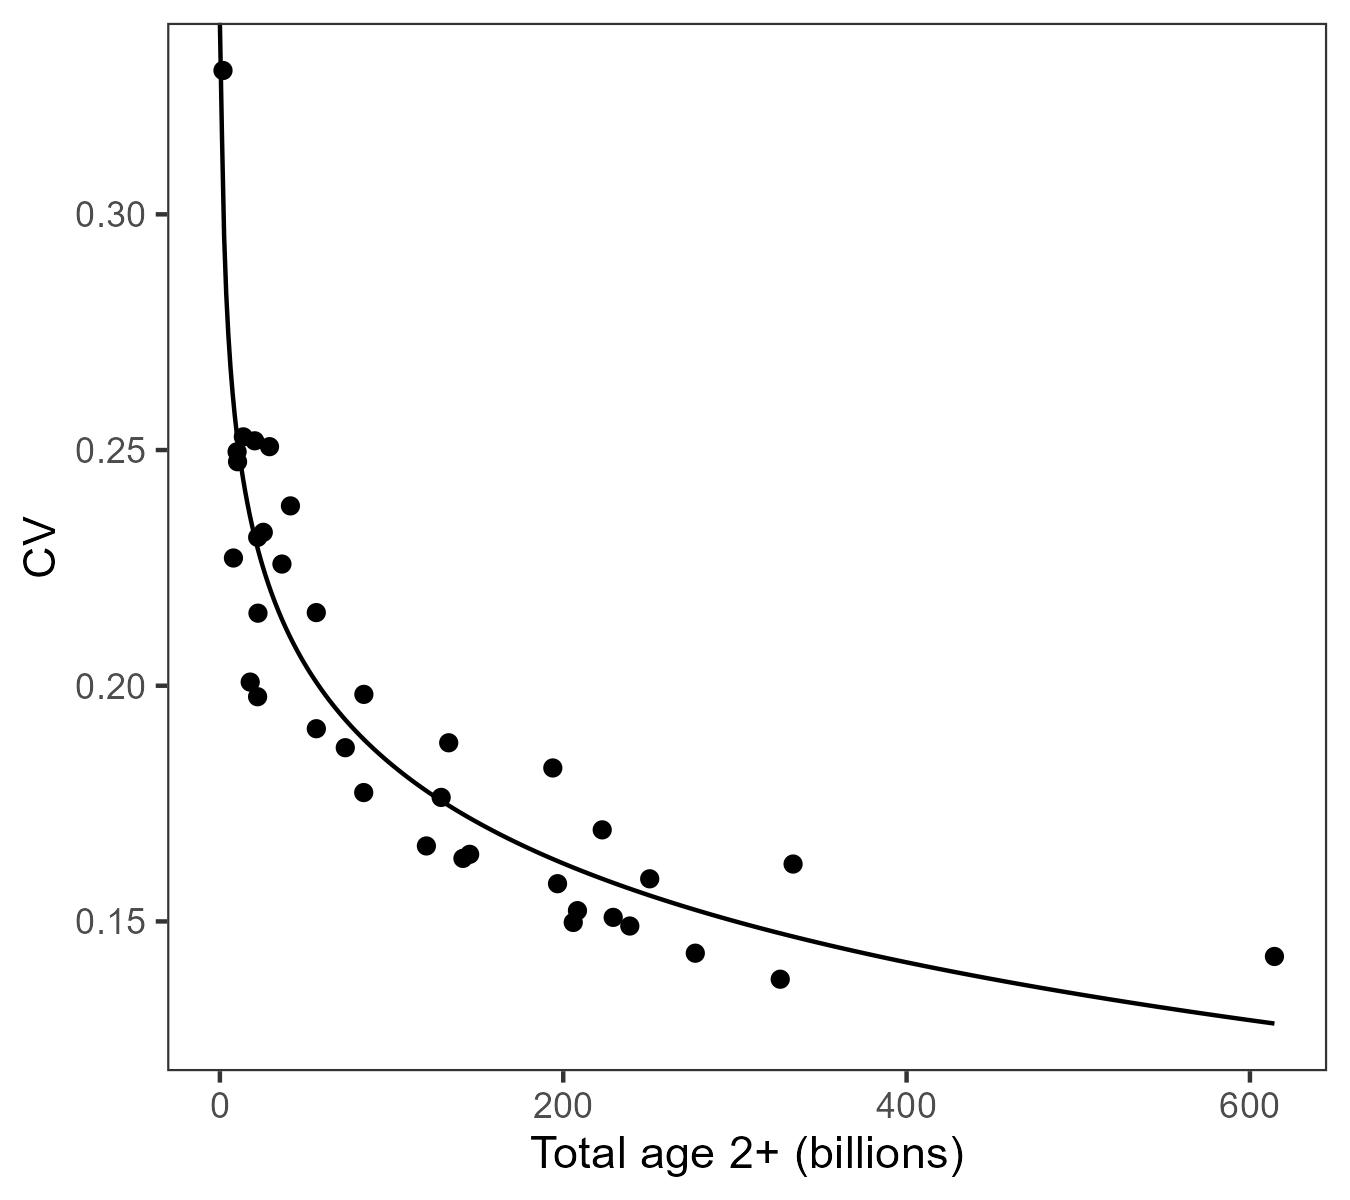
Figure 6: The CVs (y-axis) and means (x-axis) of distributions of the autumn (October 1) total age 2+ abundance from 1987-2022 as generated during OM conditioning. The curve is a log-linear model fit to the points.