Gå til hovedinnhold
Havforskningsinstituttet
HI
English
<- Tilbake
Søk
Søk
Søk
View page in English
Figur
Fra rapporten:
Report on evaluation of harvest rules for Barents Sea capelin in subareas 1 and 2 (northeast arctic), excluding division 2.a west of 5°W - full report
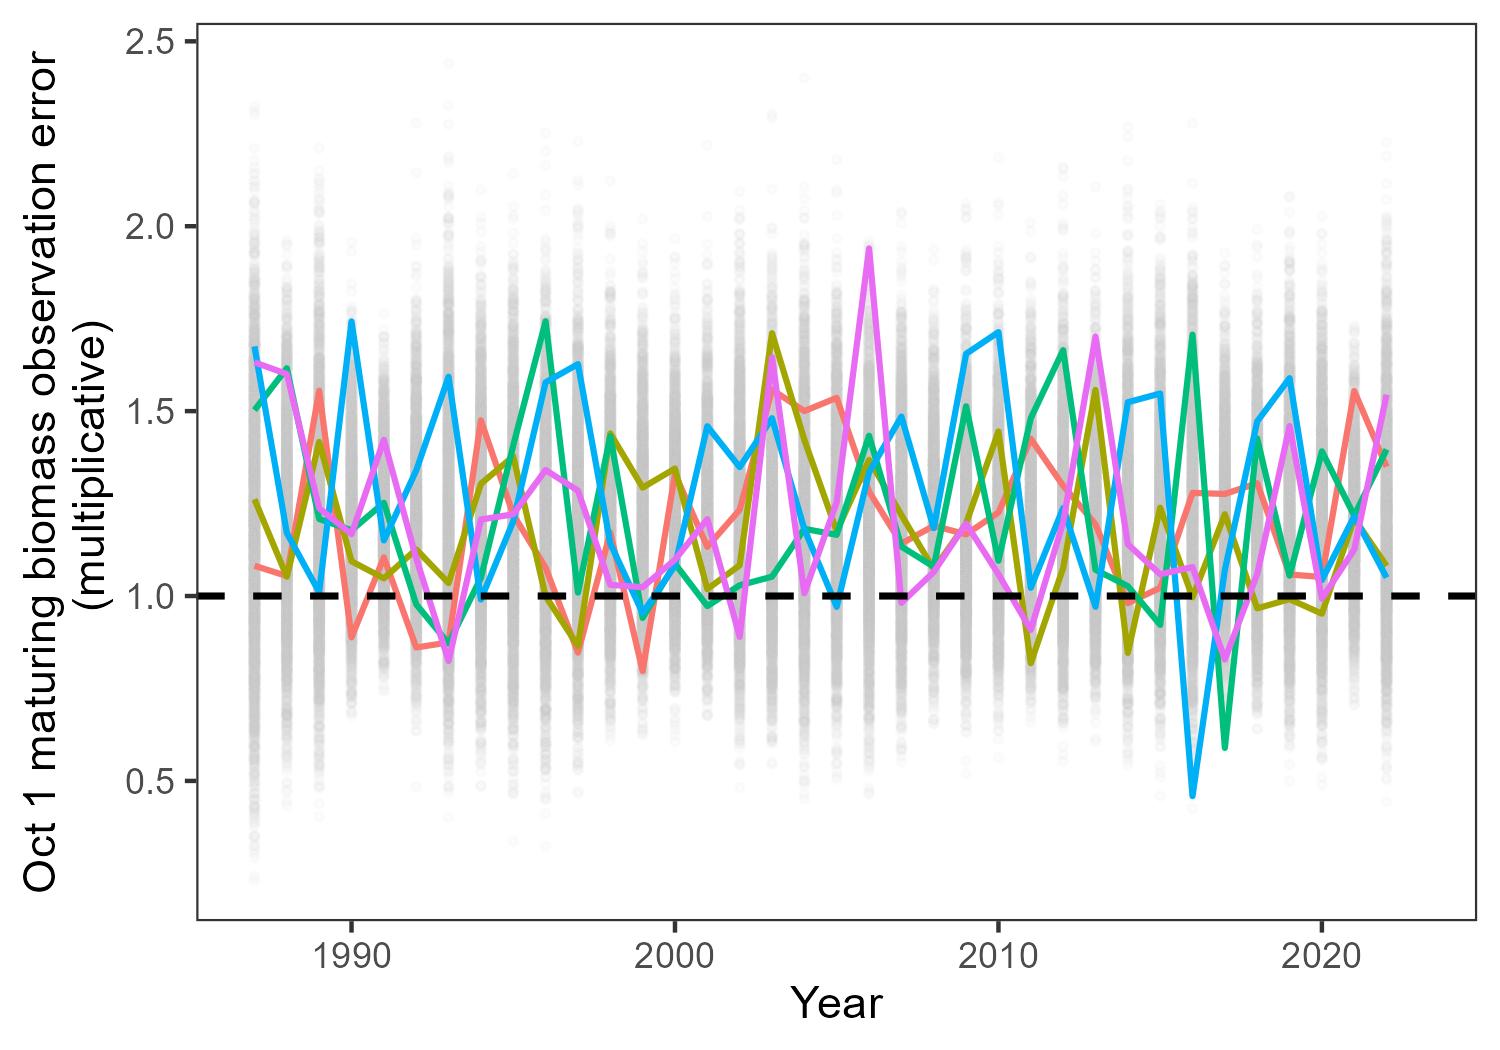
Figure 10: Annual distributions of observation errors resulting from an average upward bias of 20%. All generated errors are shown (grey points) as well as five sample trajectories of observation error over the projection period (colored lines).