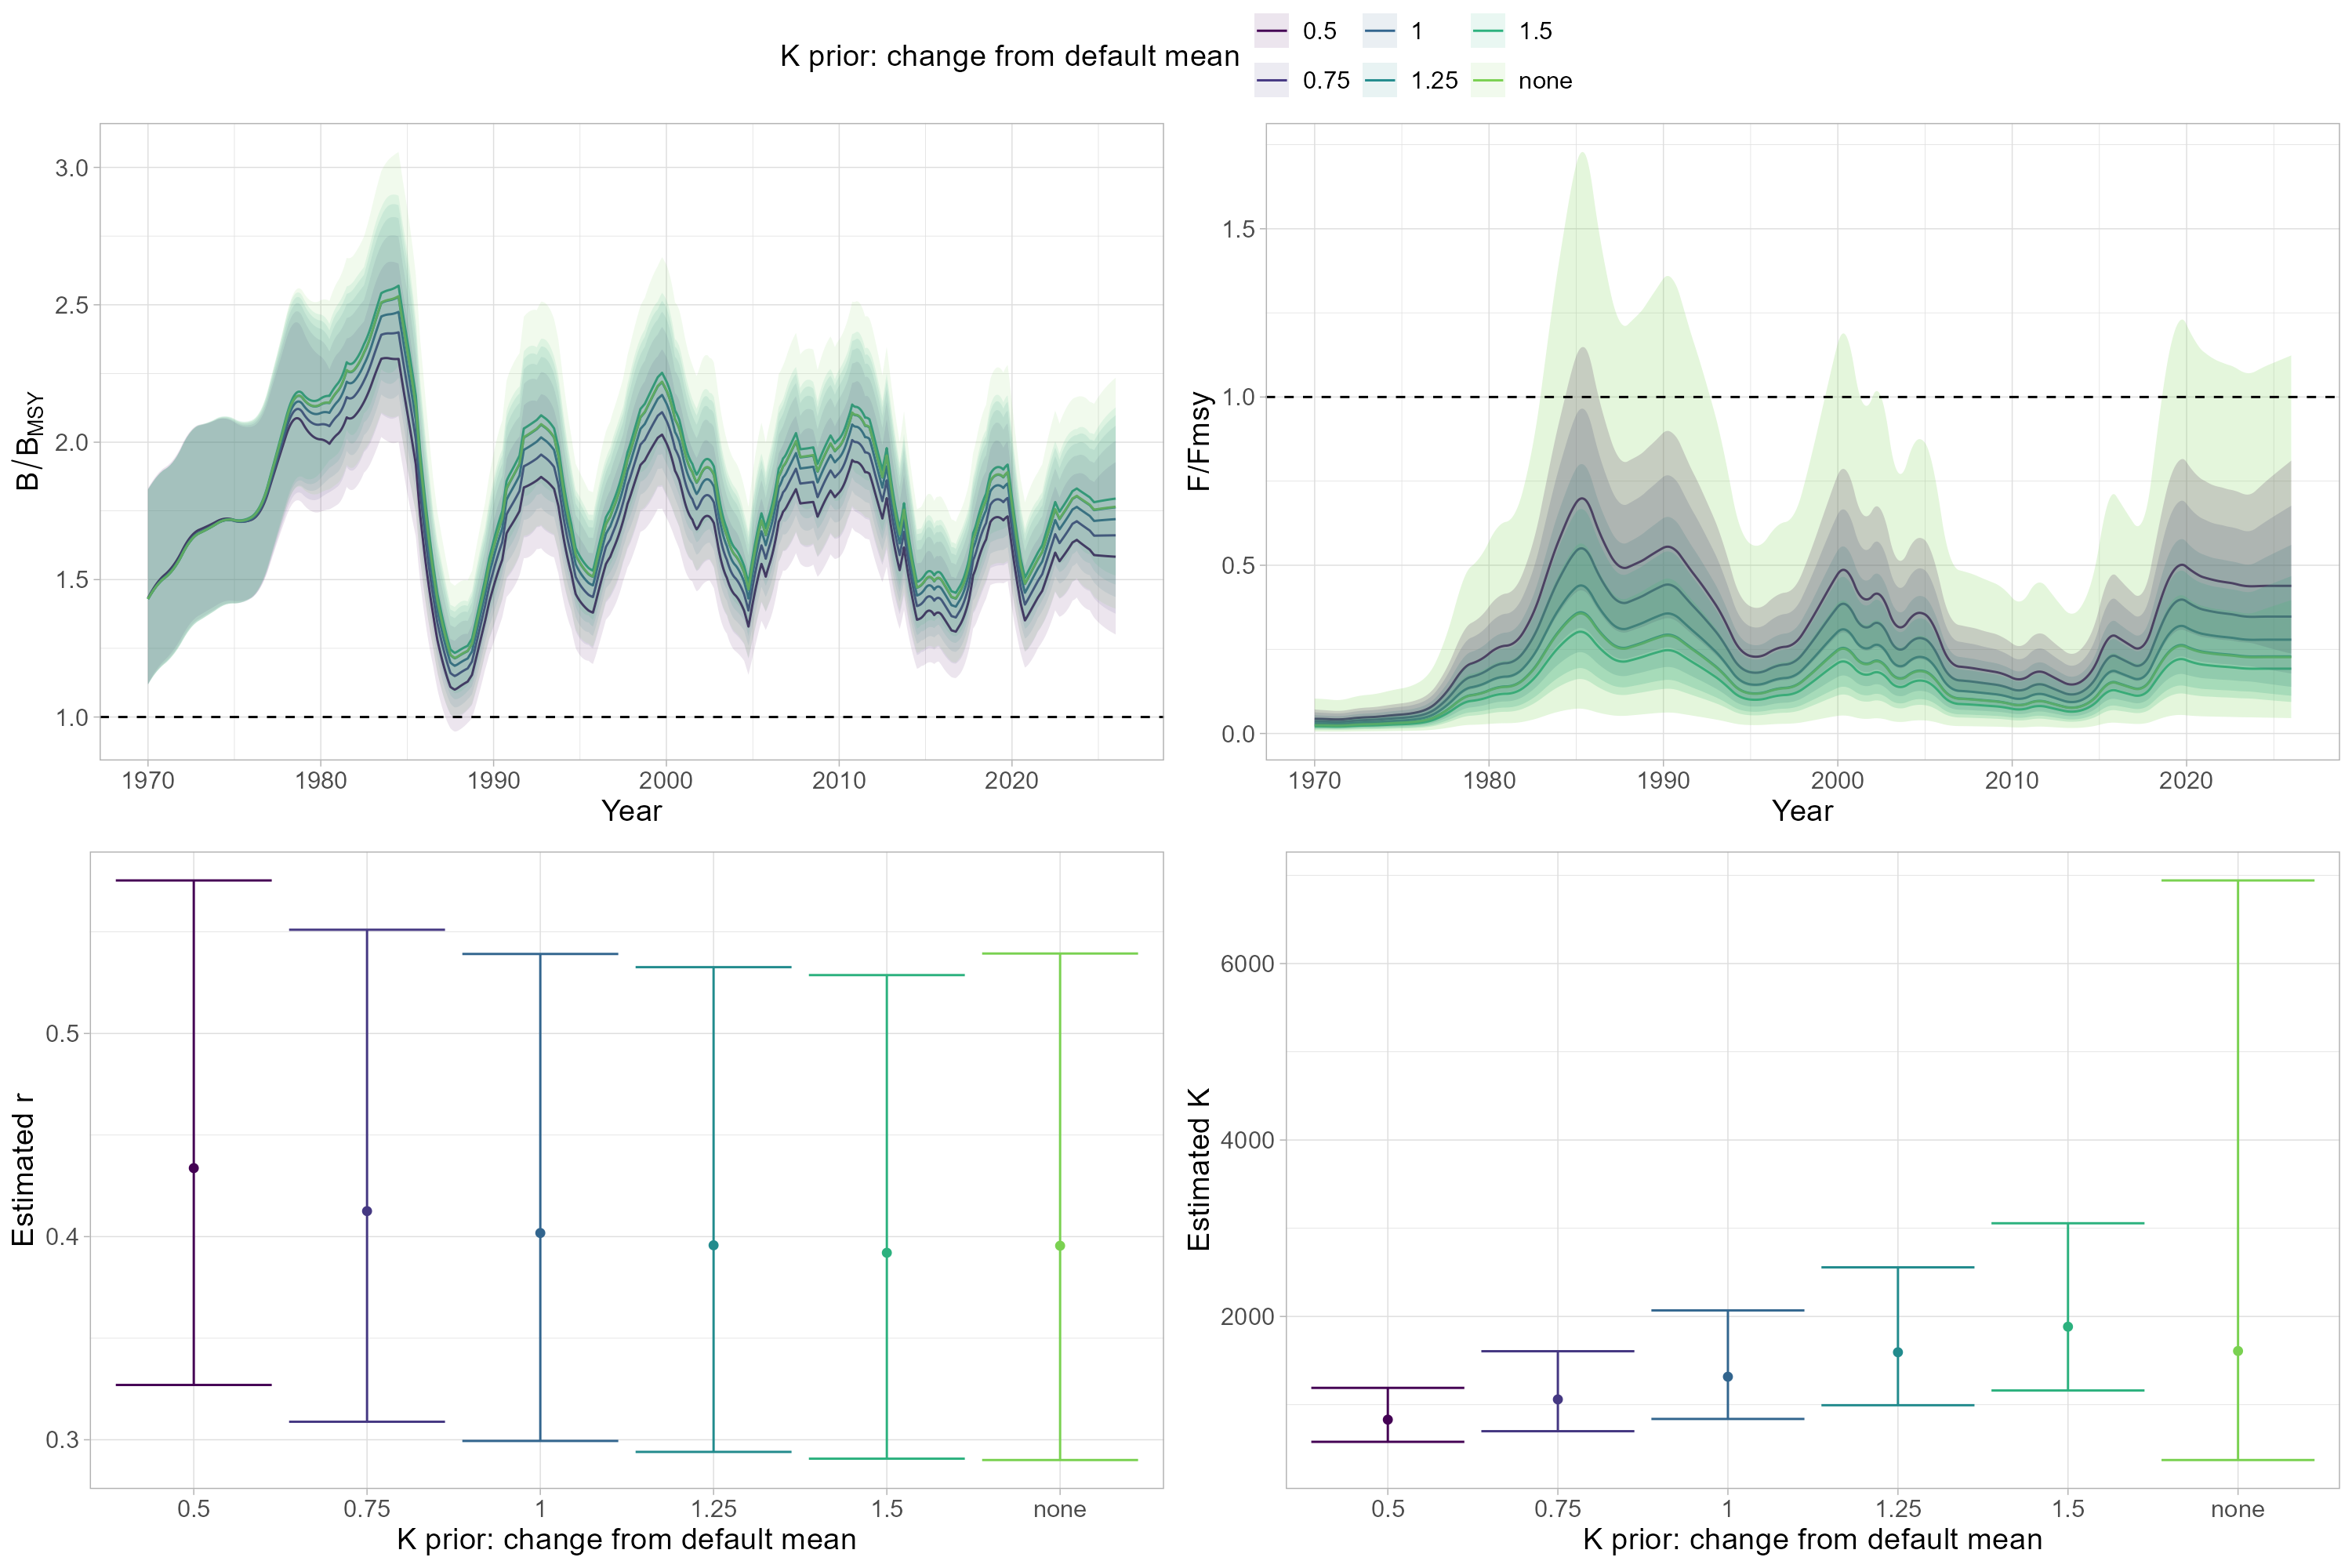
Figure 15: Sensitivity of model estimates of B/BMSY, F/FMSY, r and K to the mean of the K prior distribution. Included are model runs where K prior mean was varied between 50 and 150% of the final model configuration, as well as a model run without K prior (“none”). Shown are esti-mated means (lines/dots) and 95% confidence intervals (shaded areas/error bars).