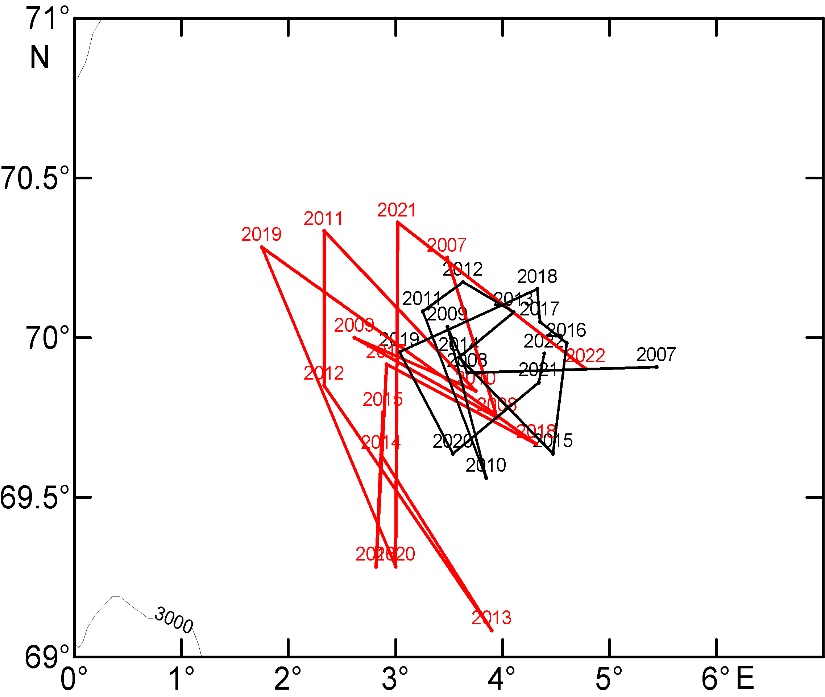
Figure 3. Inter-annual variability of positions of the stations with maximum temperatures (corresponding to the center of the vortex – red lines and numbers) and the centroids of areas with temperatures above 1 °C (black lines and numbers) at 800 m within the Lofoten vortex.