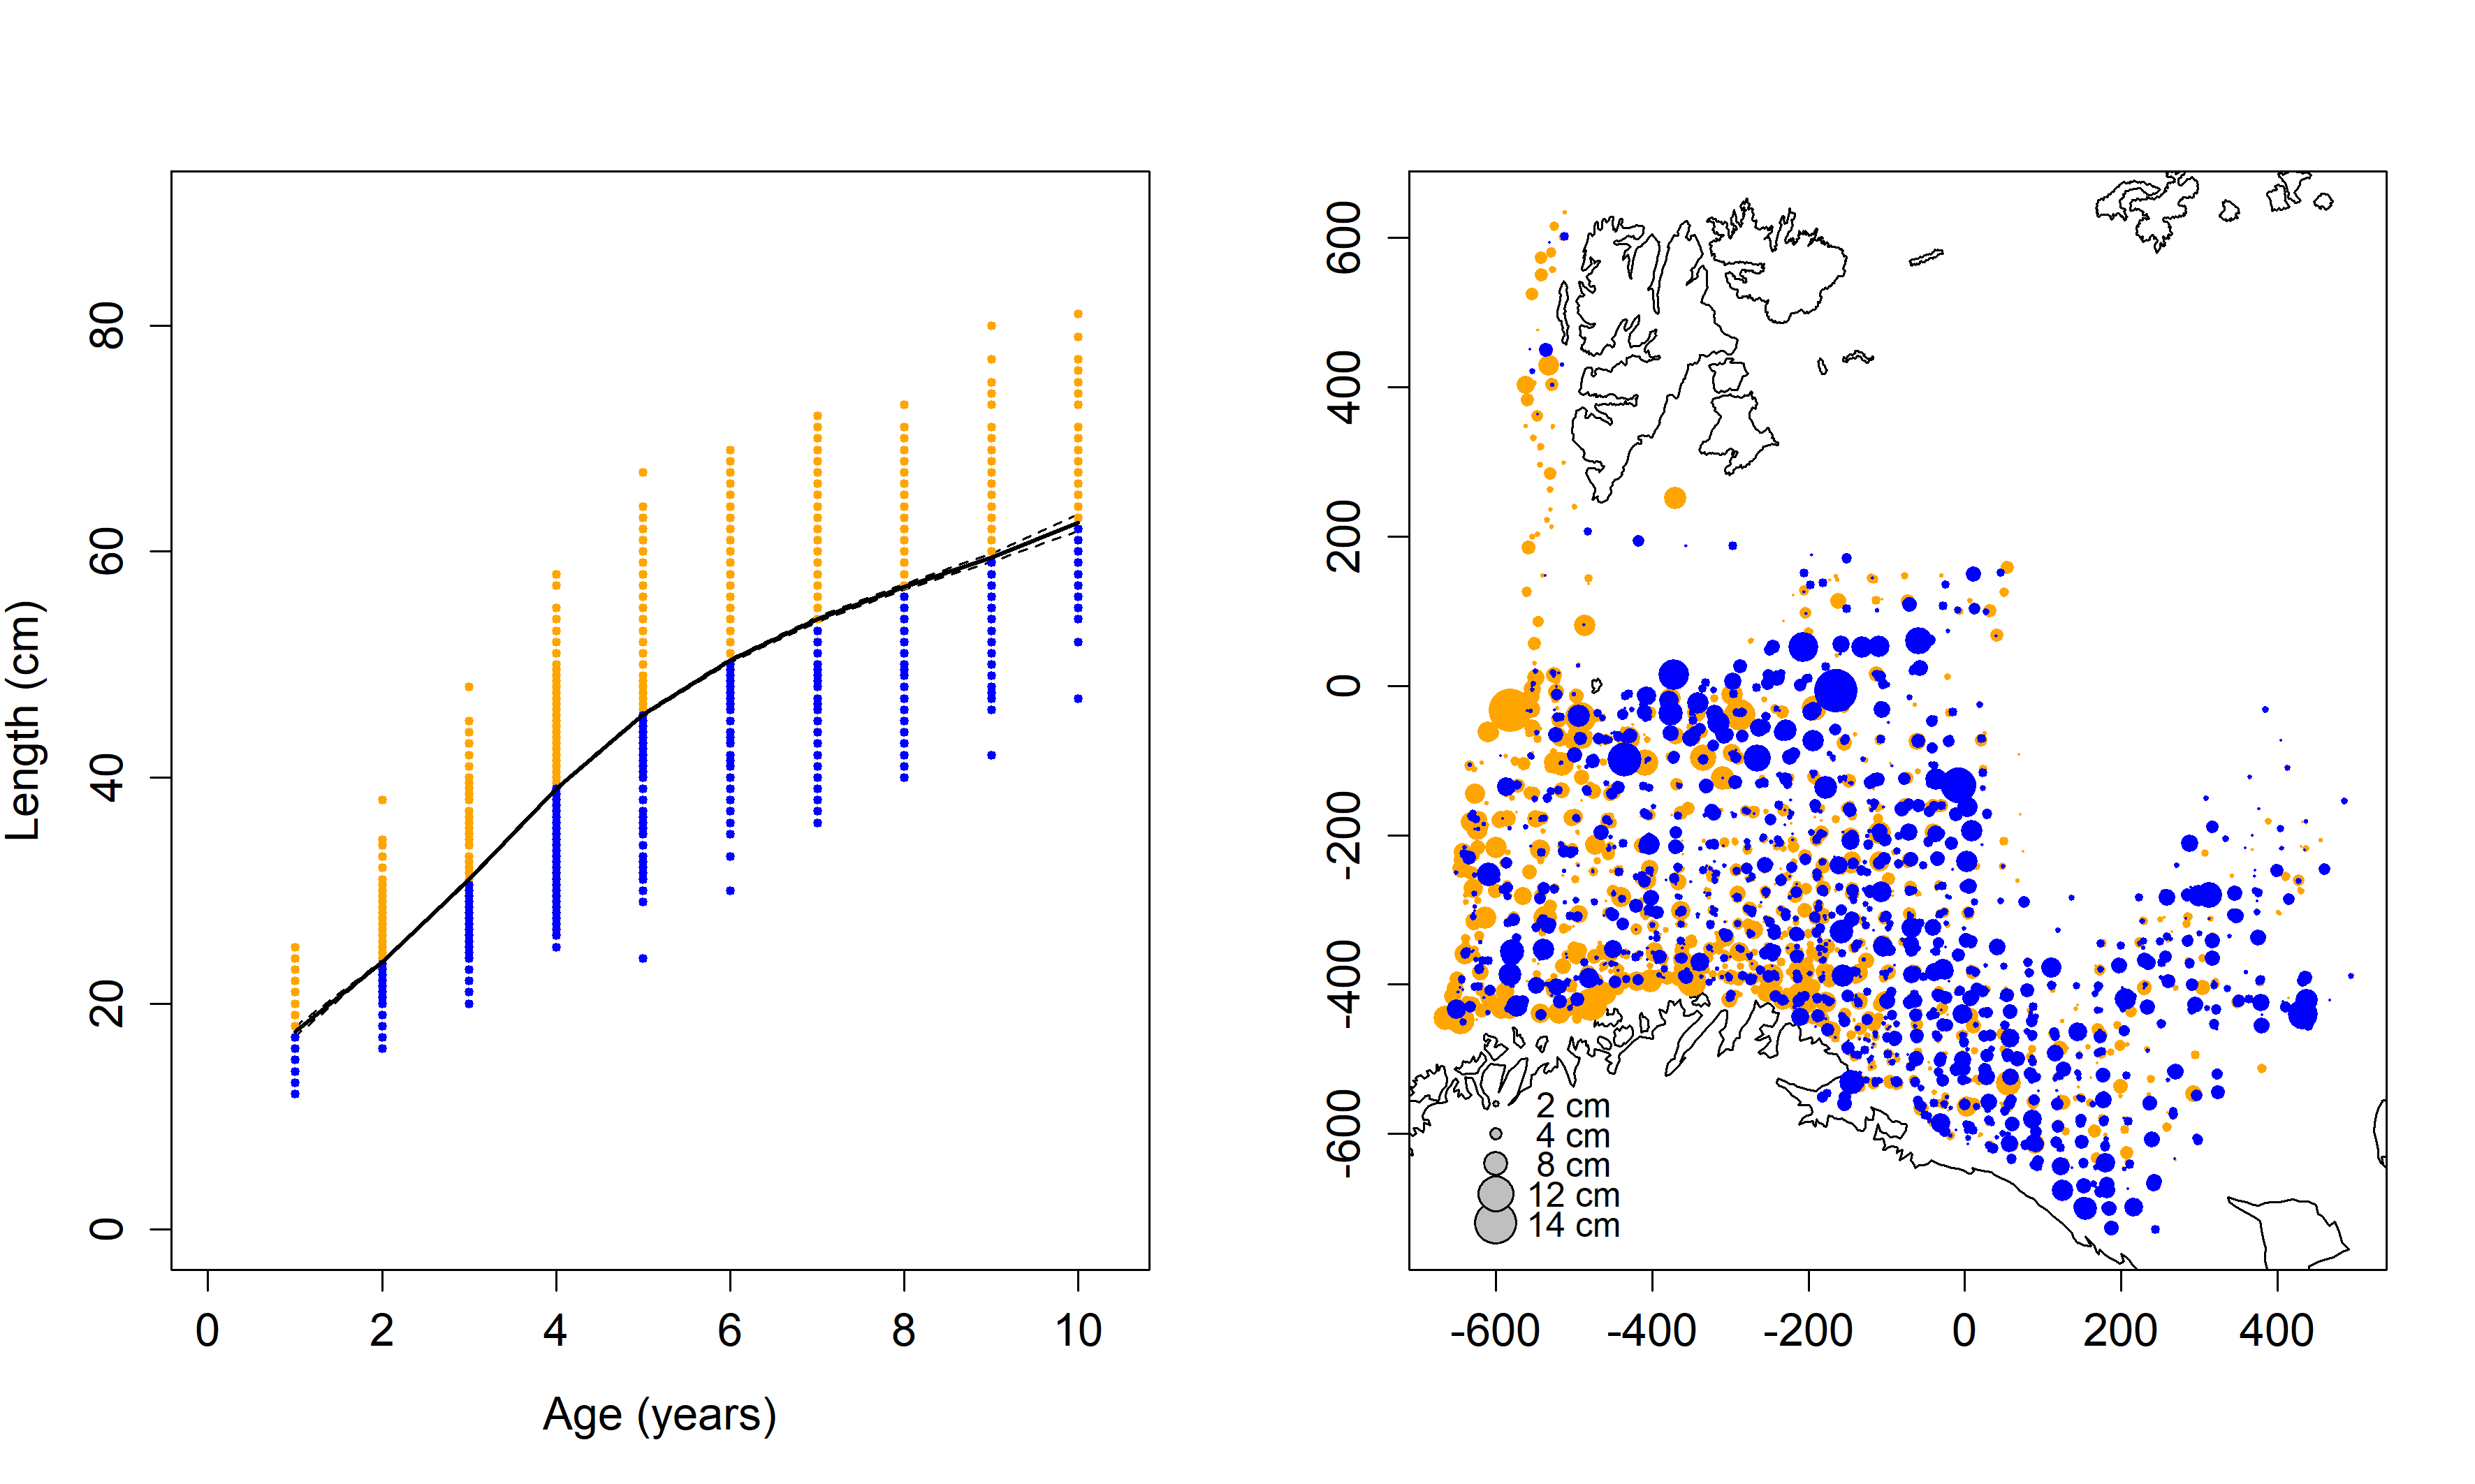
Figure 3. Left: Gam model (Eq. 2) fitted to individual length at age data (dots) from the winter survey, individuals smaller than predicted from the growth curve is shown in blue, and larger individuals are shown in orange. Right: map of residuals of all ages from eq.2, negative residuals shown in blue, positive residuals shown in orange.