Gå til hovedinnhold
Havforskningsinstituttet
HI
English
<- Tilbake
Søk
Søk
Søk
View page in English
Figur
Fra rapporten:
Multispecies management: Species interactions and trade-offs, environmental changes and multiple pressures
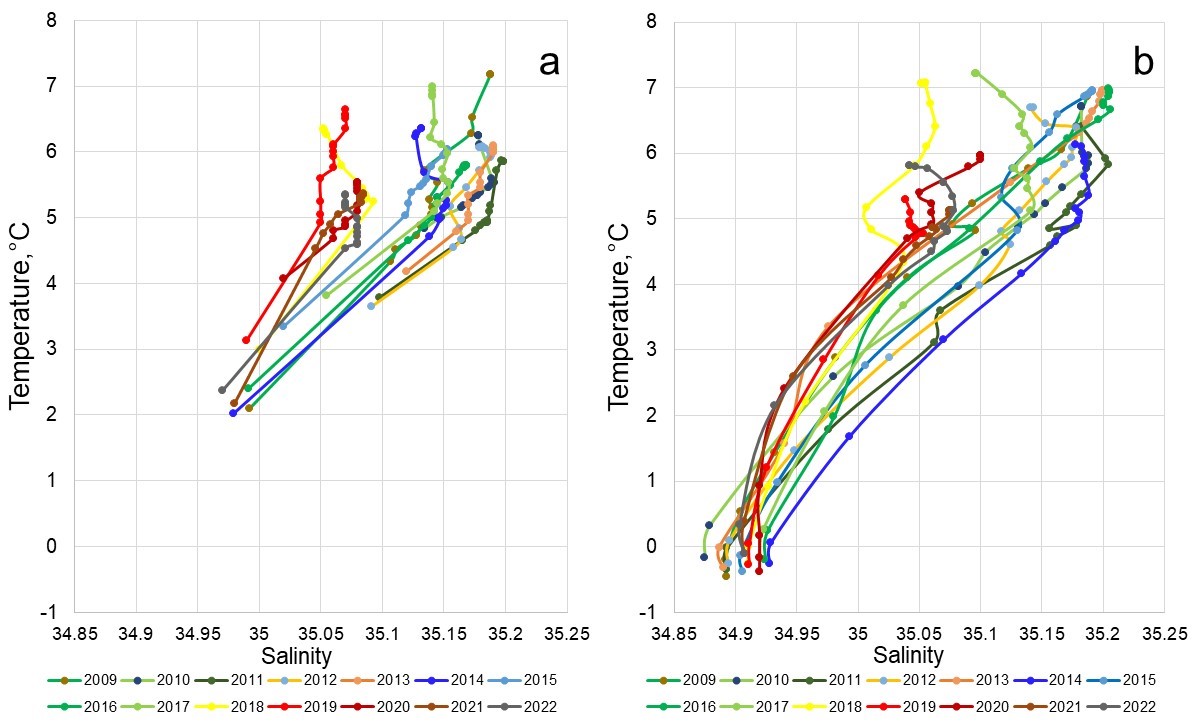
Figure 4. TS-charts based on data (0-800 m) in the center of the Lofoten vortex (a) and in nearest stations off the vortex (b) in May 2009-2022.