Gå til hovedinnhold
Havforskningsinstituttet
HI
English
<- Tilbake
Søk
Søk
Søk
View page in English
Figur
Fra rapporten:
Multispecies management: Species interactions and trade-offs, environmental changes and multiple pressures
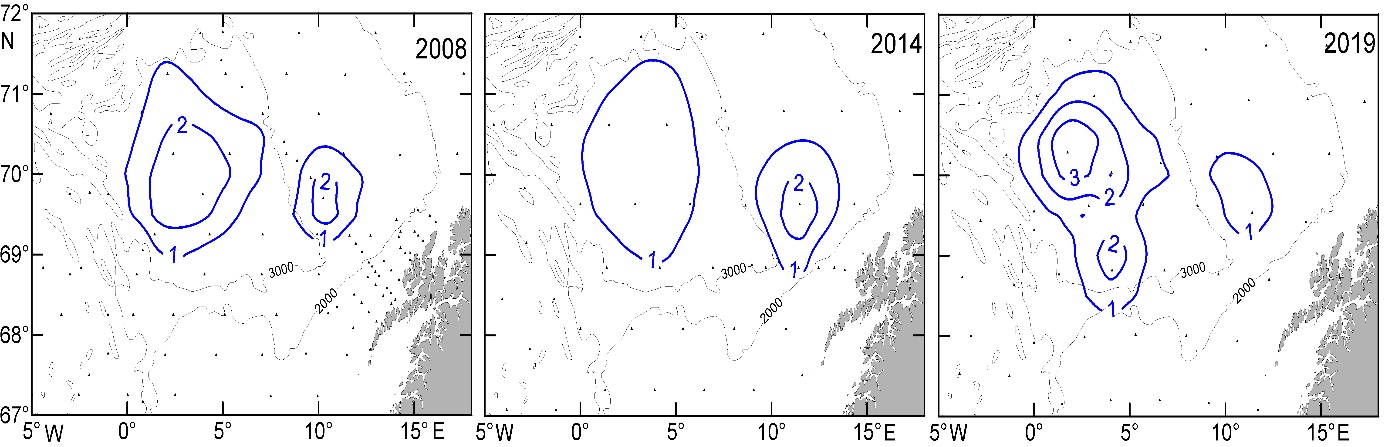
Figure 2. Positions of isotherms (°C) at 800 m in the Lofoten Basin area in May 2008, 2014 and 2019. Dots indicate the position of oceanographic stations and thin lines indicate isobaths