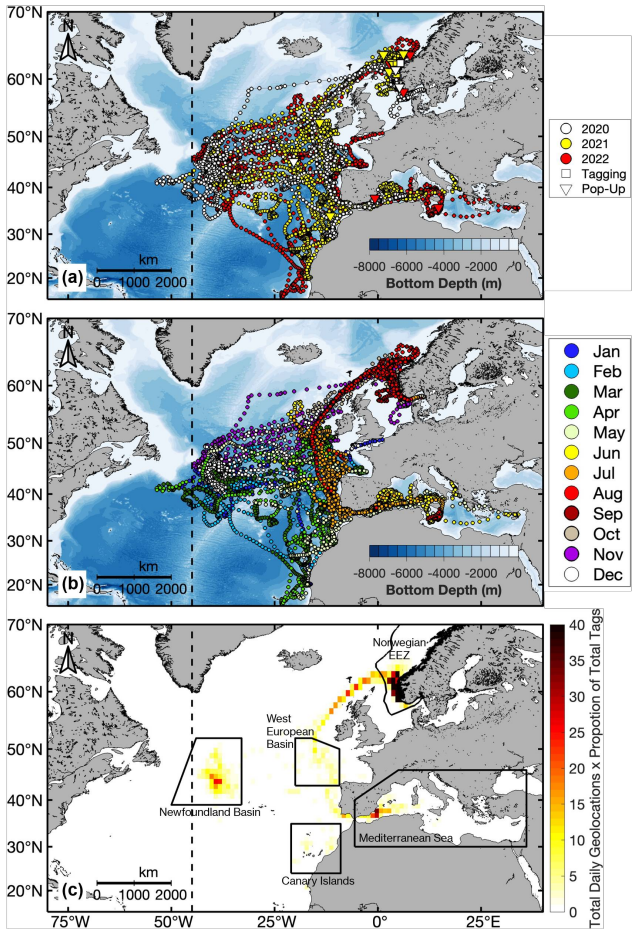
Figure 10: Tracks of electronically tagged Atlantic bluefin tuna (n = 19) released off Norway, with daily geolocations (circles) coloured by (a) deployment year and (b) month. Tagging (square) and pop-up (inverted triangle) positions are also shown in (a). (c) Number of daily geolocations within 1° × 1° latitude and longitude bins standardized by the proportion of tags in each bin. Boundaries of hotspots are outlined in solid black in (c). The ICCAT management line at the 45°W meridian is also shown (dashed black line). (Reproduced from Ferter et al. 2024)