Gå til hovedinnhold
Havforskningsinstituttet
HI
English
<- Tilbake
Søk
Søk
Søk
View page in English
Figur
Fra rapporten:
Measuring distribution and density of sprat in Norwegian fjords using a kayak drone
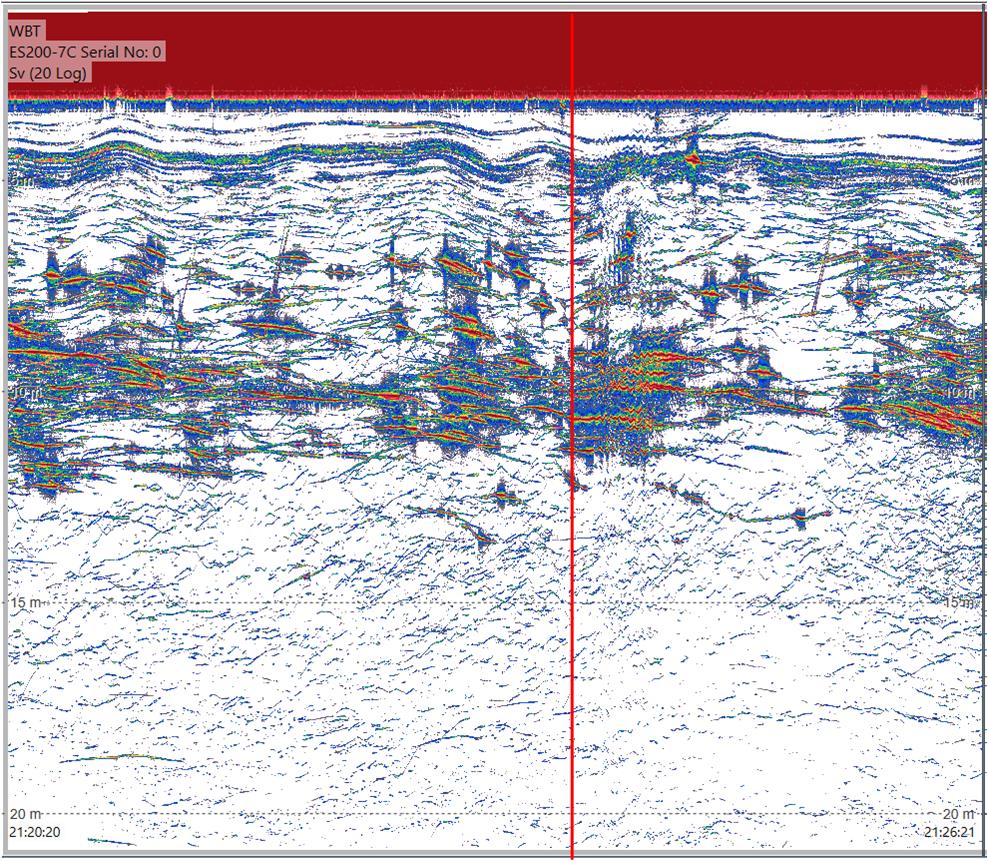
Figure A2.4 EK80 recordings from the Kayak Drone as RV Kristine Bonnevie passes close by during passing 5. A layer of sprat is detected from 3 – 15 m below the surface. The nearest point of approach is marked as a red line in the echogram.