Gå til hovedinnhold
Havforskningsinstituttet
HI
English
<- Tilbake
Søk
Søk
Søk
View page in English
Figur
Fra rapporten:
CRIMAC cruise report 2024
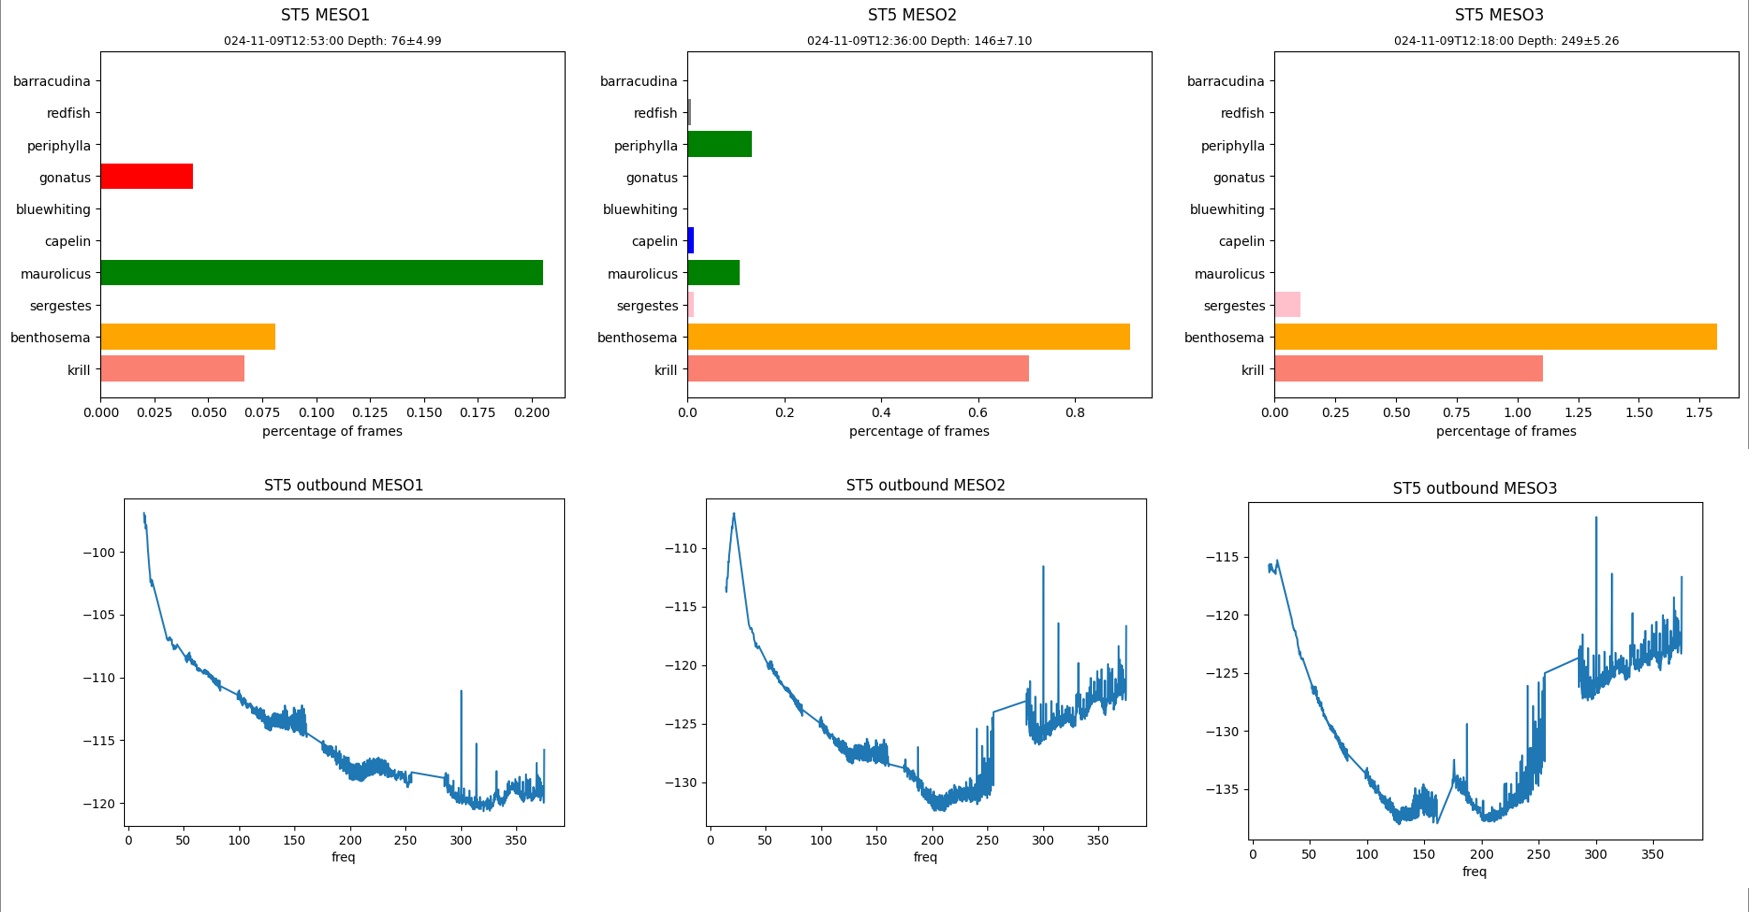
Figure 13 . The predictions from the DV (upper panels) and the frequency response for each layer on the three layers for station 5.