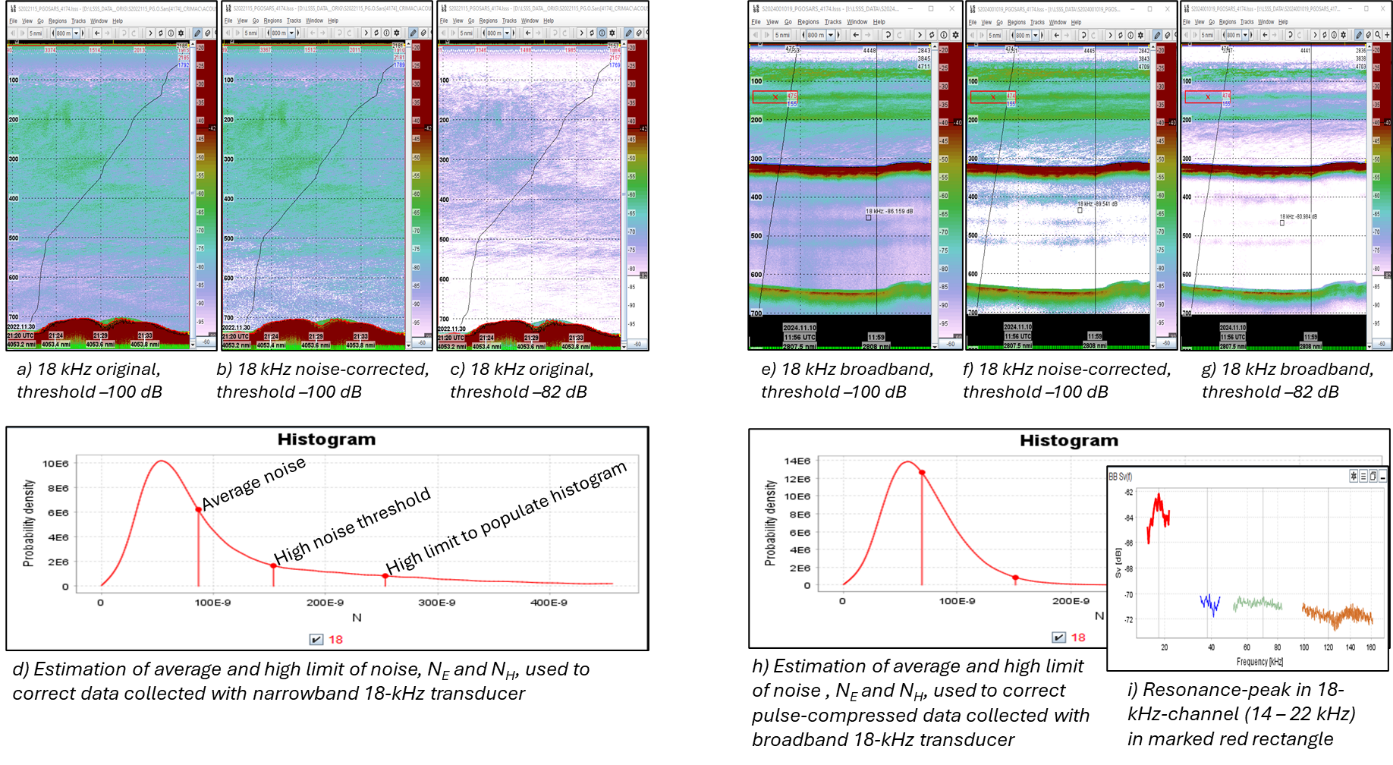
Figure 9 . Noise in 18 kHz data collected from RV G. O. Sars with old 18-kHz narrowband transducer (a - d) in survey 2022115 compared against data collected from RV G. O. Sars new 18-kHz broadband transducer (e – h) in survey 2024001019. Figure (i) shows the resonance peak from the red rectangle in the broadband echograms.