Gå til hovedinnhold
Havforskningsinstituttet
HI
English
<- Tilbake
Søk
Søk
Søk
View page in English
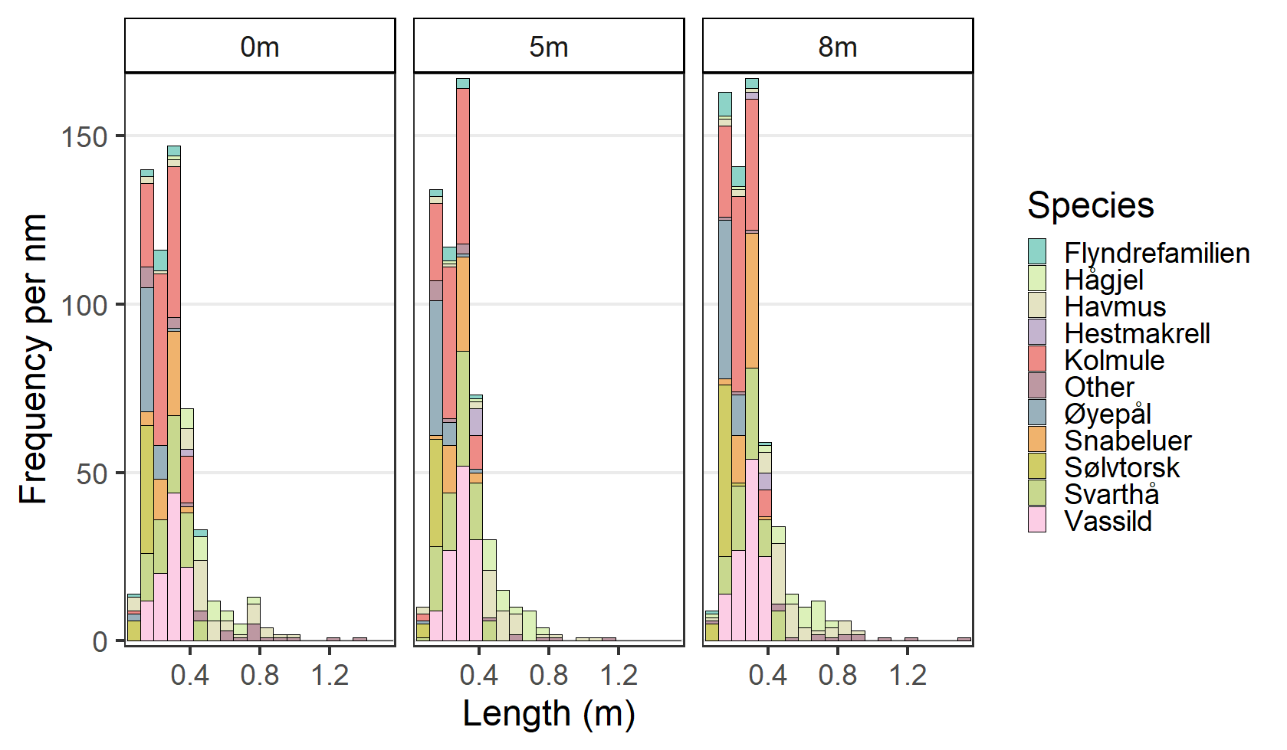
Figur
Fra rapporten:
CRIMAC cruise report 2024
Figure 25 : Length distribution of catch, normalised per nautical mile (nm). Colours represent the dominant species, with the remainder grouped to ‘other’ to aid visual clarity. Plot faceted by size of sediment suppression sheet tested.