Figure
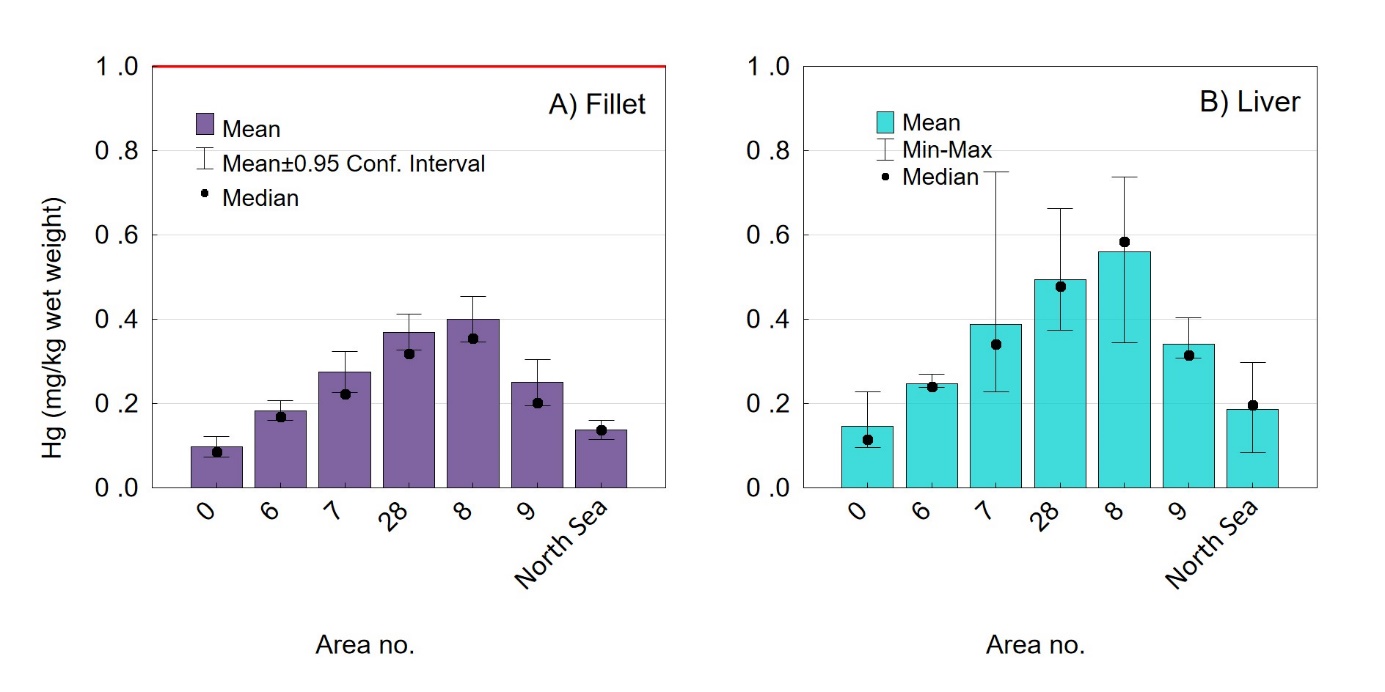
22 Variation in Hg concentration (mg/kg wet
weight) in A) fillet and B) liver of anglerfish ( Lophius
piscatorius ) sampled in different
areas along the Norwegian coast (from north to south: area no. 00 to
09) and in the North Sea. For fillet, mean ± 95% confidence interval
and median are given. For liver, mean, minimum, maximum and median
values are shown. The red line marks the EU and Norway’s maximum
level set for Hg in fillet of anglerfish for human consumption, which
does not apply to liver.