Figure
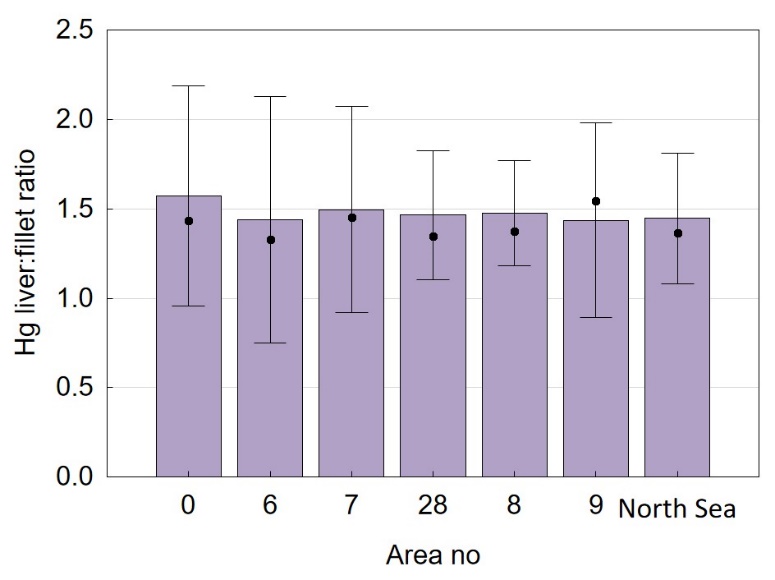
24 . Variation in Hg liver:fillet ratio (Hg
liver/Hg fillet) of anglerfish ( Lophius
piscatorius ) sampled in different
areas along the Norwegian coast (from north to south: area no. 00 to
09) and in the North Sea. Mean, minimum, maximum and median values
are shown. The ratios are calculated based on measured Hg values in
composite liver samples and mean values of the Hg concentrations in
corresponding individual fillet samples.