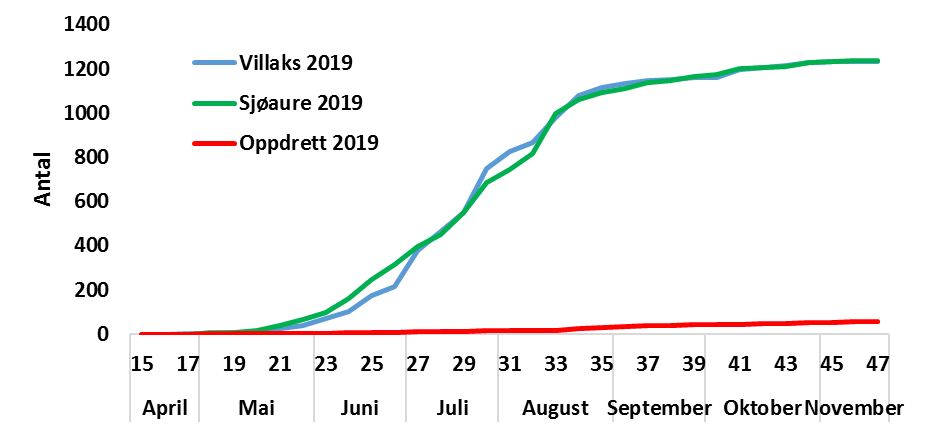
Figur 3. Kumulativ oppvandring av vill og rømt laks og sjøaure
pr veke i fella 2019, absolutt tal (øverst) og andel av total
(nederst). Cumulative upstream migration of
escaped salmon, and wild salmon and sea trout captured in the fish
trap per week in 2019, with absolute numbers (upper) and frequency of
total (lower).