Gå til hovedinnhold
Havforskningsinstituttet
HI
English
<- Tilbake
Søk
Søk
Søk
View page in English
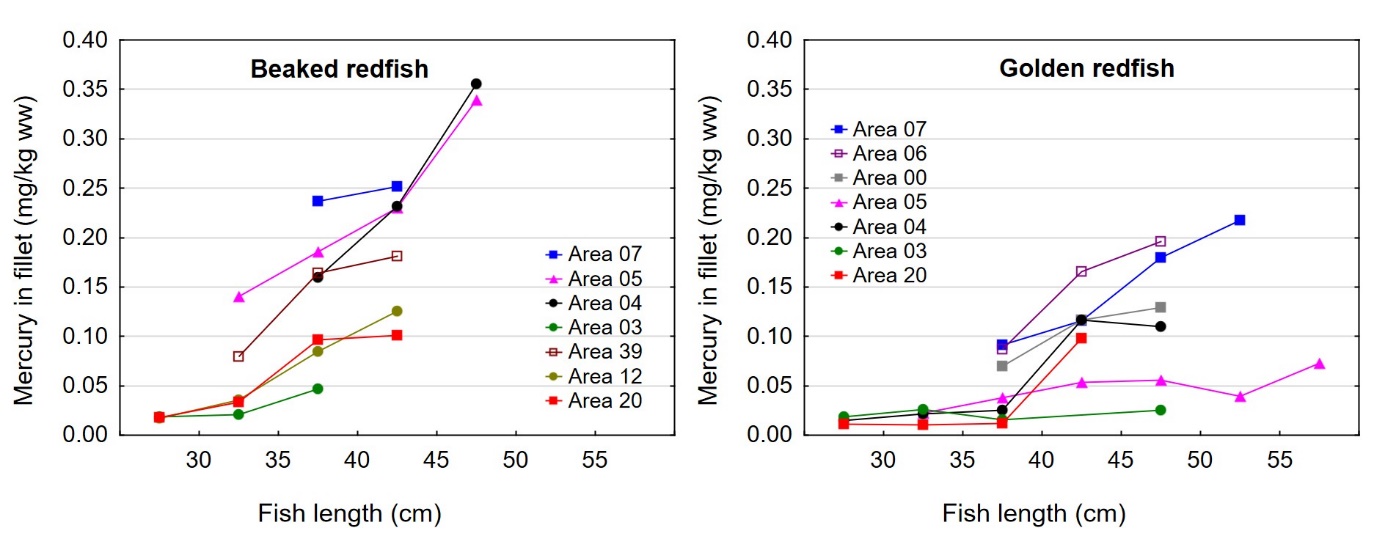
Figur
Fra rapporten:
Fremmedstoffer i snabeluer (Sebastes mentella) og vanlig uer (Sebastes norvegicus)
Figure 10. Mercury concentration in fillet of beaked redfish (left) and golden redfish (right) in different fish length intervals and categorised by statistics area. The different areas are given different colours and symbols. Mean values are shown.