Figure
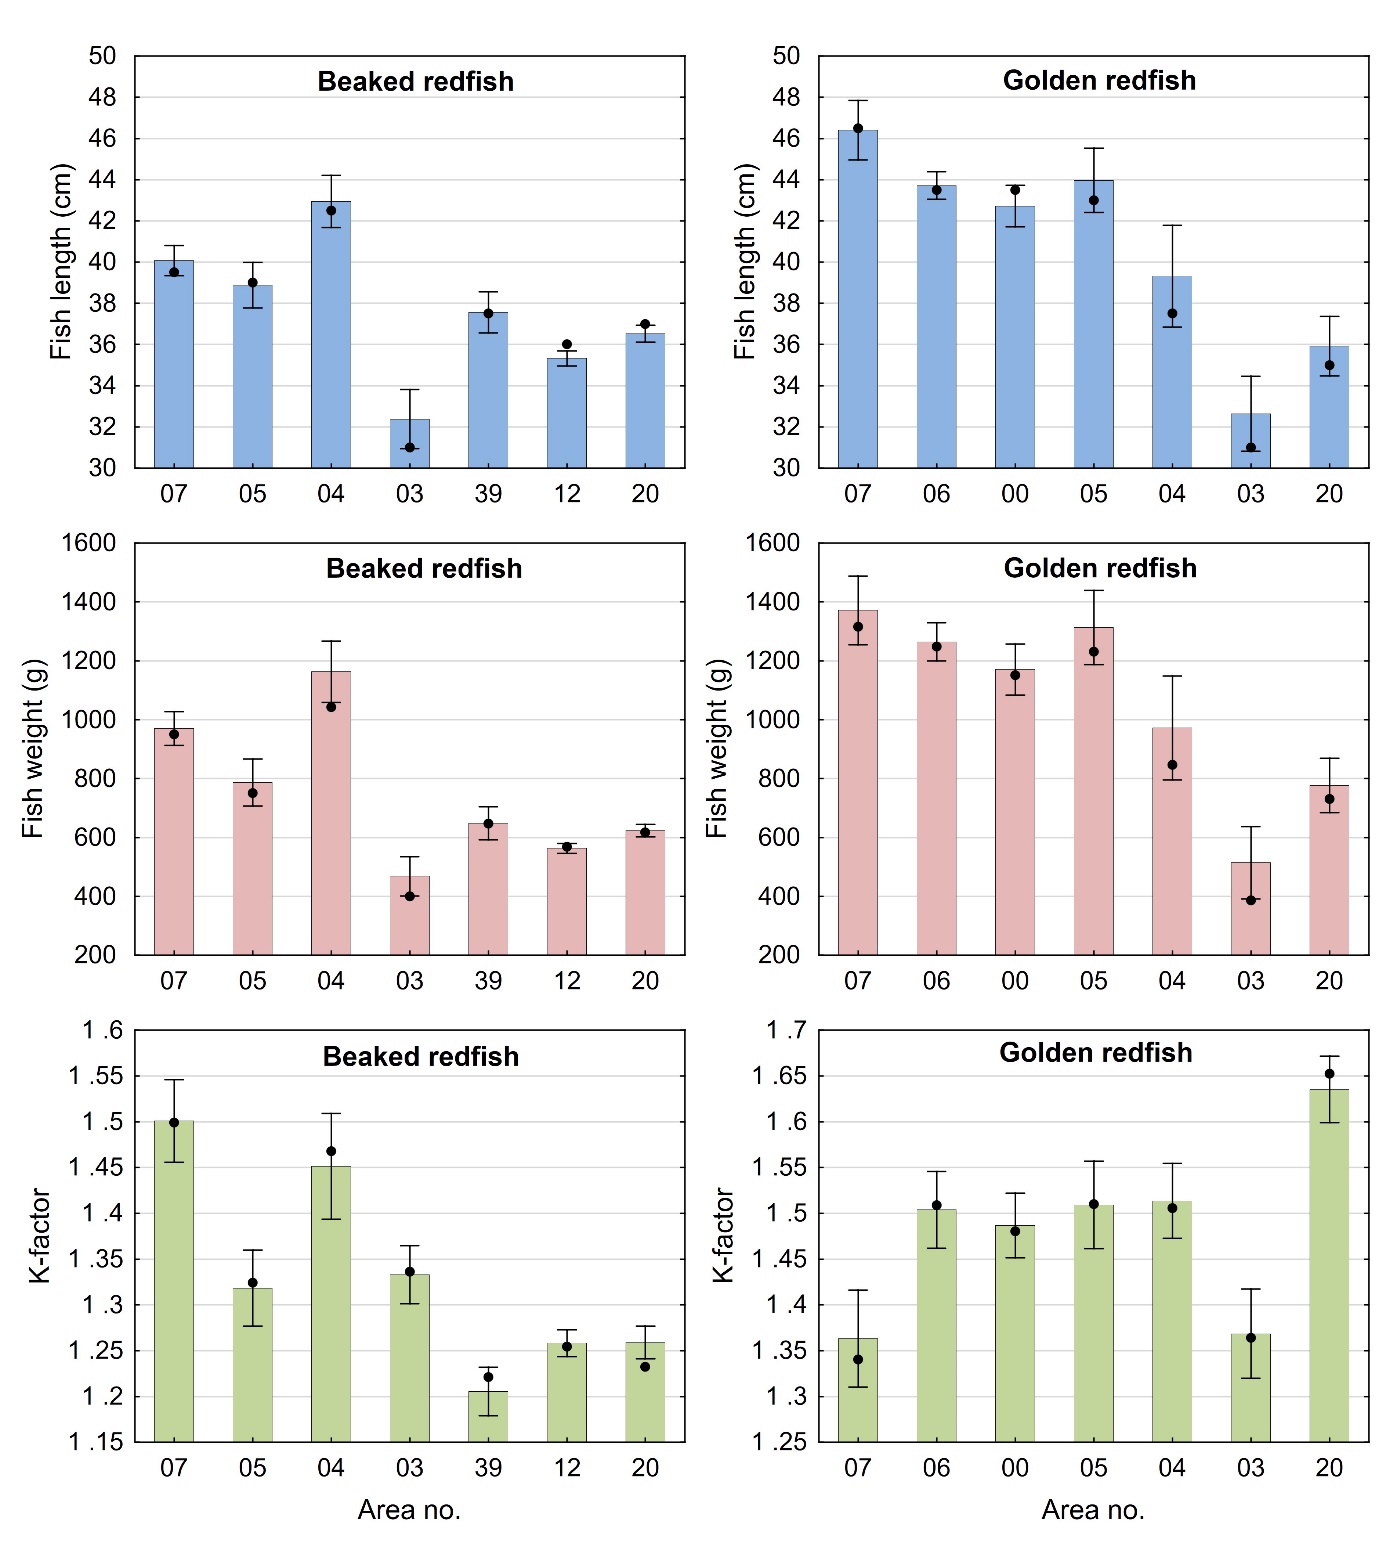
3. Fish length (cm), weight (g) and K-factor (weight*100/length 3 )
of beaked redfish (left) and golden redfish (right) sampled in
different areas (see figure 1 and 2 for geographical location of the
different areas) in the Norwegian Sea and Barents Sea in 2016-2018.
Columns and error bars indicate mean values ± 95% confidence
intervals and black dots mark median values.