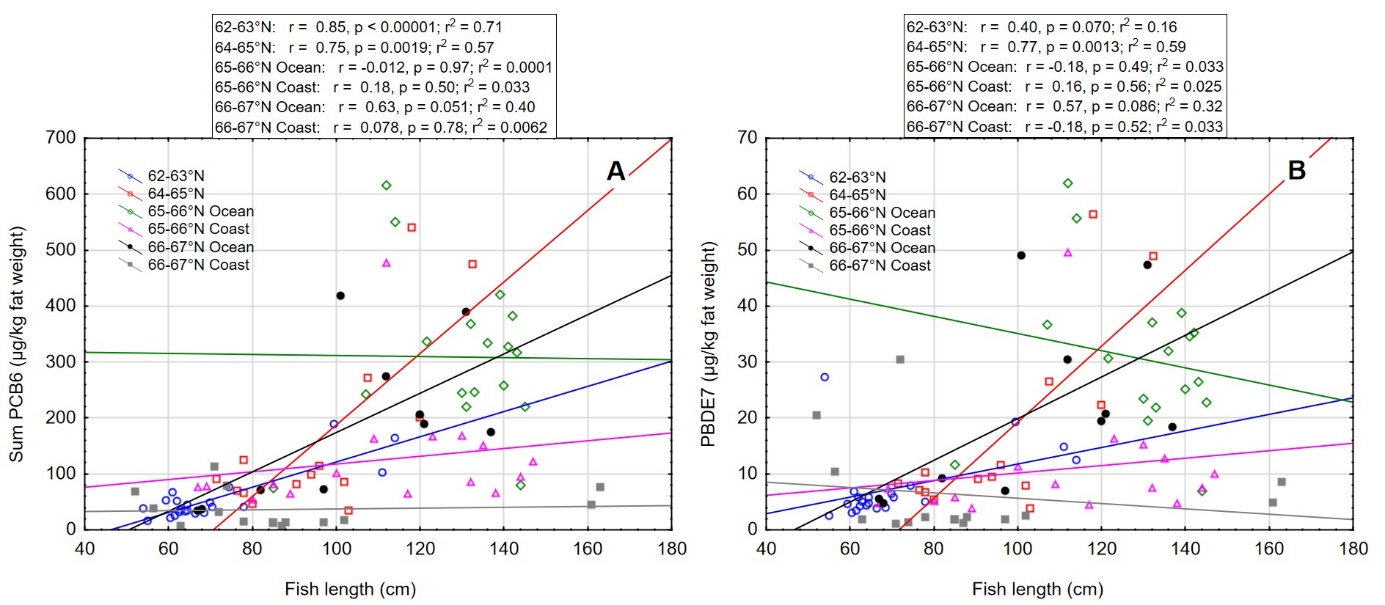
Figur 13. Linear regression between concentration of A) sum PCB6 and B) sum PBDE7 on fat weight basis (µg/kg fat weight) and fish length (cm) for Atlantic halibut collected in different areas in the Norwegian Sea in 2019 (see figure 1 for geographical location of the different areas). Halibut from area 65-66°N Ocean were collected within (12 fish) and right outside of (5 fish) the area closed for halibut fishing. Results of Pearson’s linear correlation for each area are given above the graph.