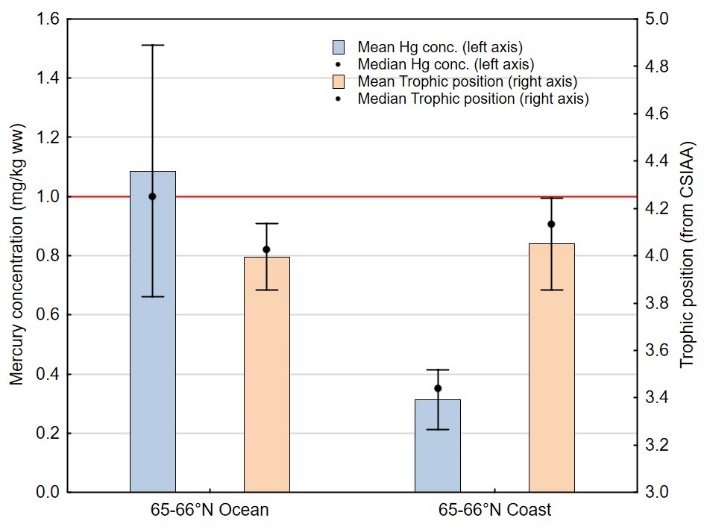
Figure 7. Mercury concentration in muscle (mg/kg wet weight, left axis) and trophic position (right axis) of Atlantic halibut collected in two different areas in the Norwegian Sea in 2019 (see figure 1 for geographical location of the different areas). Trophic position was determined by compound specific isotope analysis of amino acids (CSIAA), and ten fish of pairwise identical length were included from each area. Halibut from area 65-66°N Ocean were collected within (8 fish) and right outside of (2 fish) the area closed for halibut fishing. Mean ± 95% confidence intervals and median (black dots) are given. The red horizontal line indicates the EU and Norway’s maximum level for mercury in muscle meat of Atlantic halibut for human consumption.