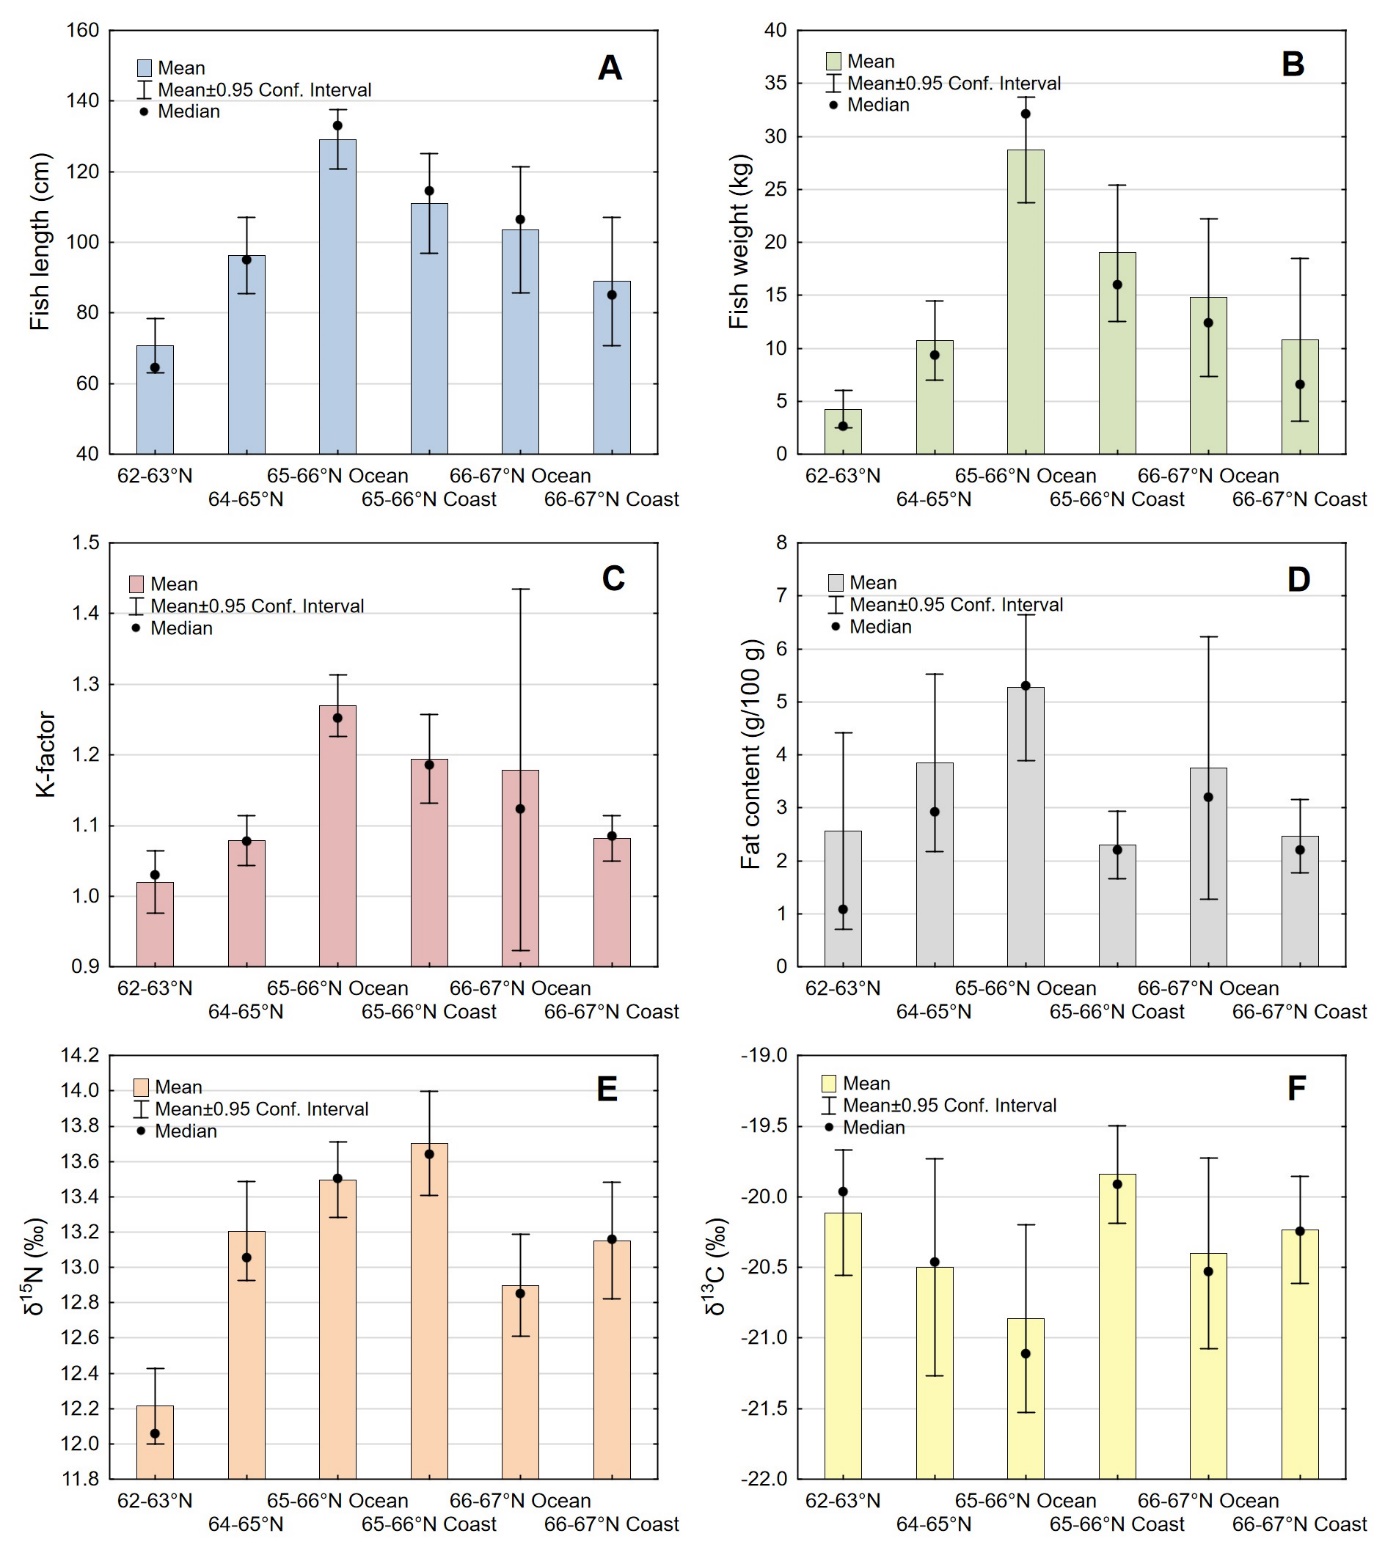
Figure 3. A) Fish length (cm), B) weight (kg), C) K-factor (weight*100/length3), D) fat content (g/100g), E) δ15N and F) δ13C of Atlantic halibut collected in different areas in the Norwegian Sea in 2019 (see figure 1 for geographical location of the different areas). Halibut from area 65-66°N Ocean were collected within (12 fish) and right outside of (5 fish) the area closed for halibut fishing. Columns and error bars indicate mean values ± 95% confidence intervals and black dots mark median values.