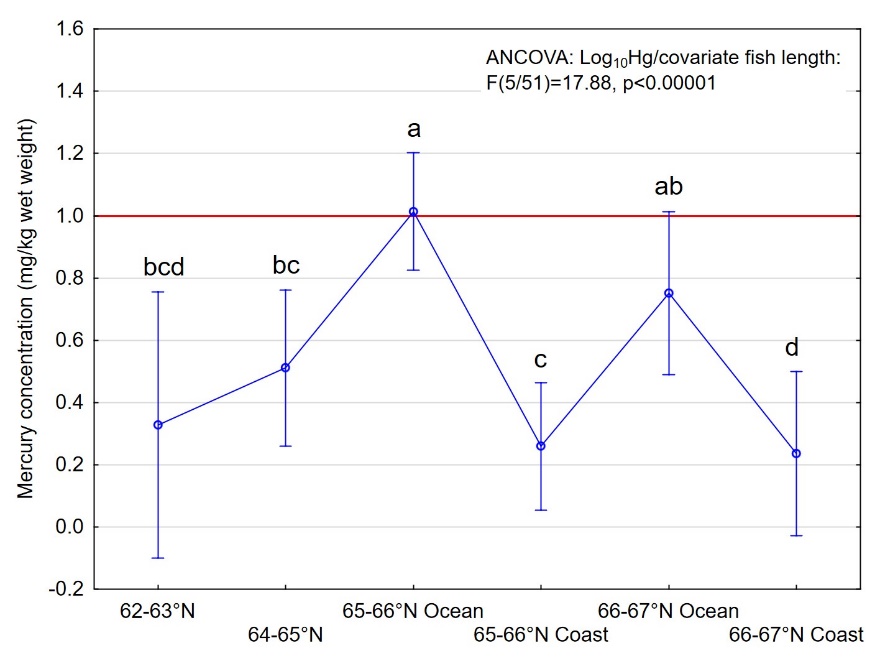
Figure 6. Length-adjusted mercury concentration in B-cut of muscle (mg/kg wet weight) from Atlantic halibut collected in different areas in the Norwegian Sea in 2019. The mercury concentrations were adjusted for length using ANCOVA, and only fish with length above 80 cm were included in the analysis. Least square mean ± 95% confidence interval is shown for each area. Results of ANCOVA are shown in the graph. Letters above the graph indicate significant or non-significant differences between the areas, i.e. different letters indicate significant difference between the areas, while one or more identical letter(s) indicate no significant difference between the areas. ANCOVA was performed on log10-transformed Hg-concentrations and raw data are presented in the graph. The red horizontal line indicates the EU and Norway’s maximum level for mercury in muscle meat of Atlantic halibut for human consumption.