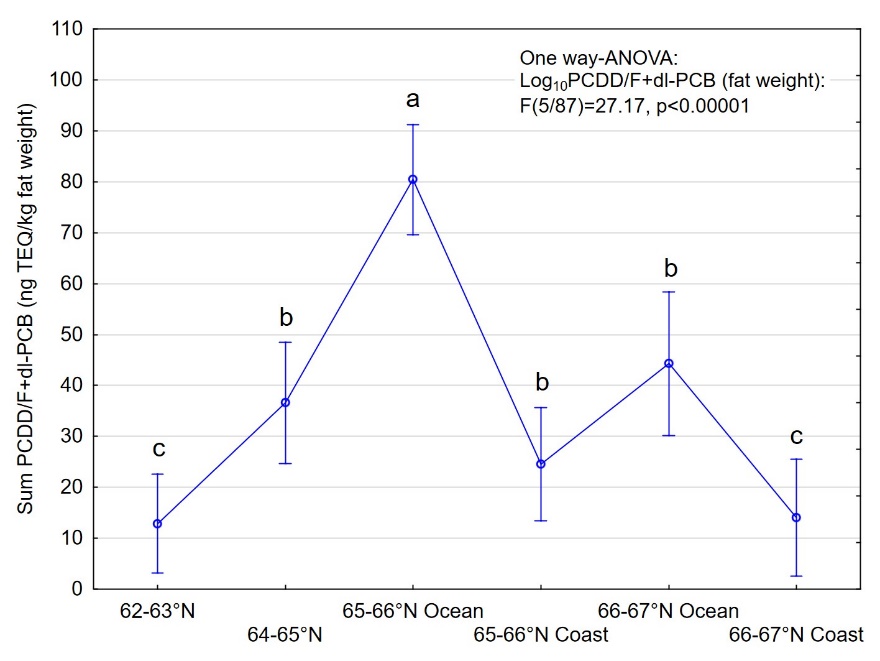
Figure 11. Concentrations of sum PCDD/F+dl-PCB on fat weight basis (ng TEQ/kg fat weight) in muscle (B-cut) of Atlantic halibut collected in different areas in the Norwegian Sea in 2019. Least square mean ± 95% confidence interval is shown for each area. Results of ANOVA are shown in the graph. Letters above the graph indicate significant or non-significant differences between the areas, i.e. different letters indicate significant difference between the areas, while identical letters indicate no significant difference between the areas. ANOVA was performed on log10-transformed concentrations and raw data are presented in the graph.