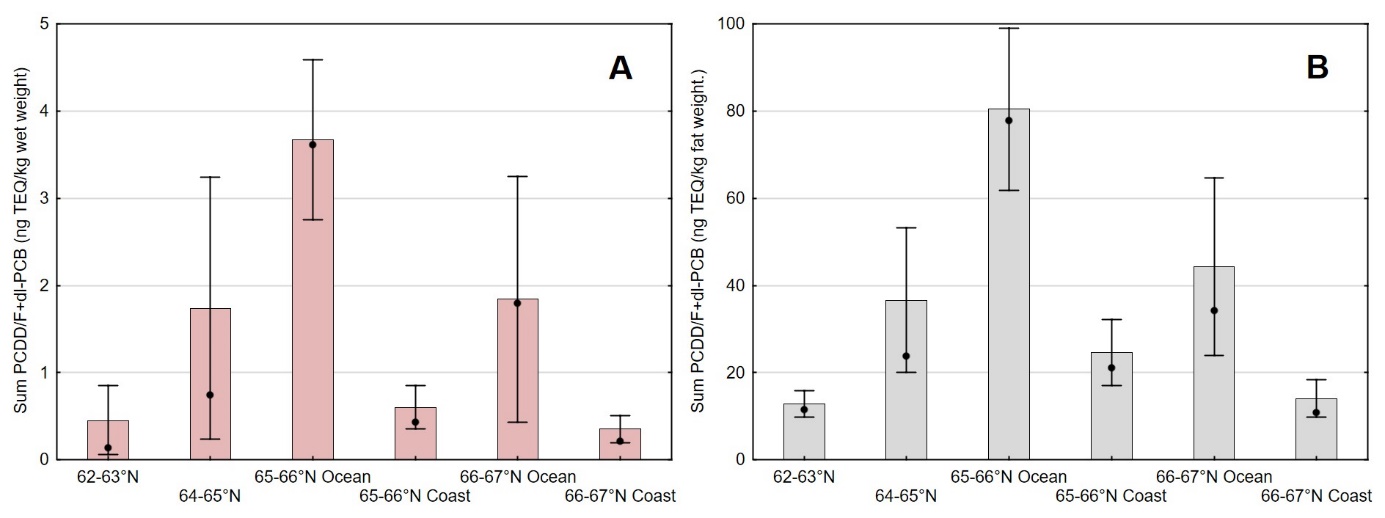
Figure 10. Concentration of sum PCDD/F+dl-PCB on A) wet weight basis (ng TEQ/kg wet weight) or B) fat weight basis (ng TEQ/kg fat weight) in B-cut of muscle from Atlantic halibut collected in different areas in the Norwegian Sea in 2019 (see figure 1 for geographical location of the different areas). Mean ± 95% confidence intervals and median (black dots) are given.