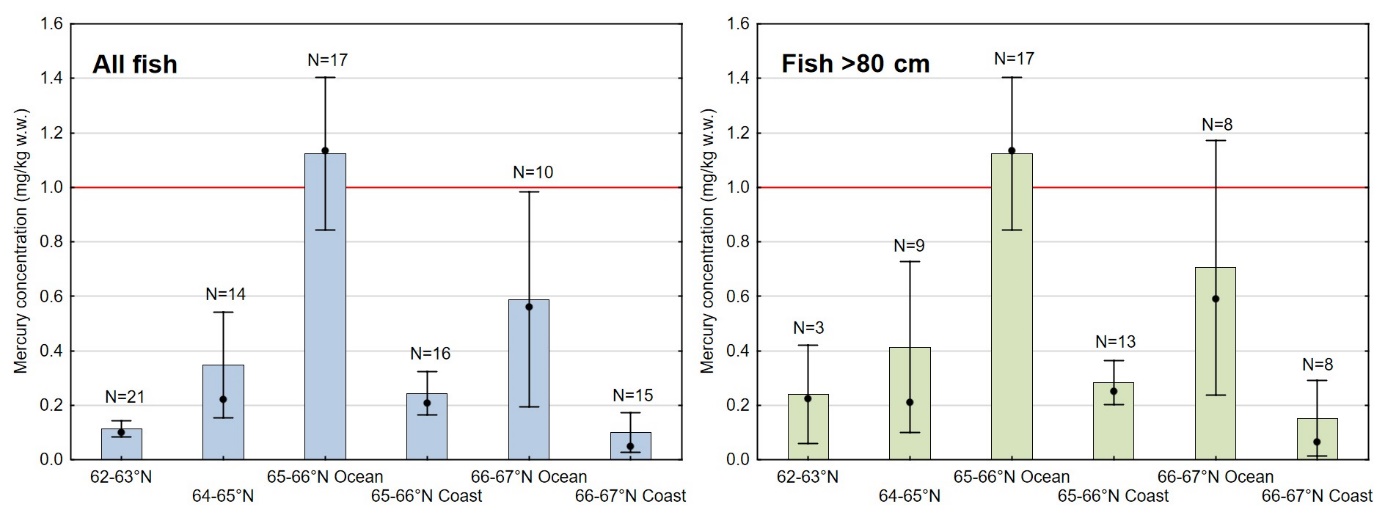
Figure 5. Concentration of mercury in B-cut of muscle (mg/kg wet weight) from Atlantic halibut collected in different areas in the Norwegian Sea in 2019 (see figure 1 for geographical location of the different areas). The left panel shows the results for all fish in the study, and the right panel shows results for fish with length above 80 cm. Mean ± 95% confidence intervals and median (black dots) are given. The red horizontal line indicates the EU and Norway’s maximum level for mercury in muscle meat of Atlantic halibut for human consumption.