Gå til hovedinnhold
Havforskningsinstituttet
HI
English
<- Tilbake
Søk
Søk
Søk
View page in English
Figur
Fra rapporten:
Risikorapport norsk fiskeoppdrett 2021 - kunnskapsstatus
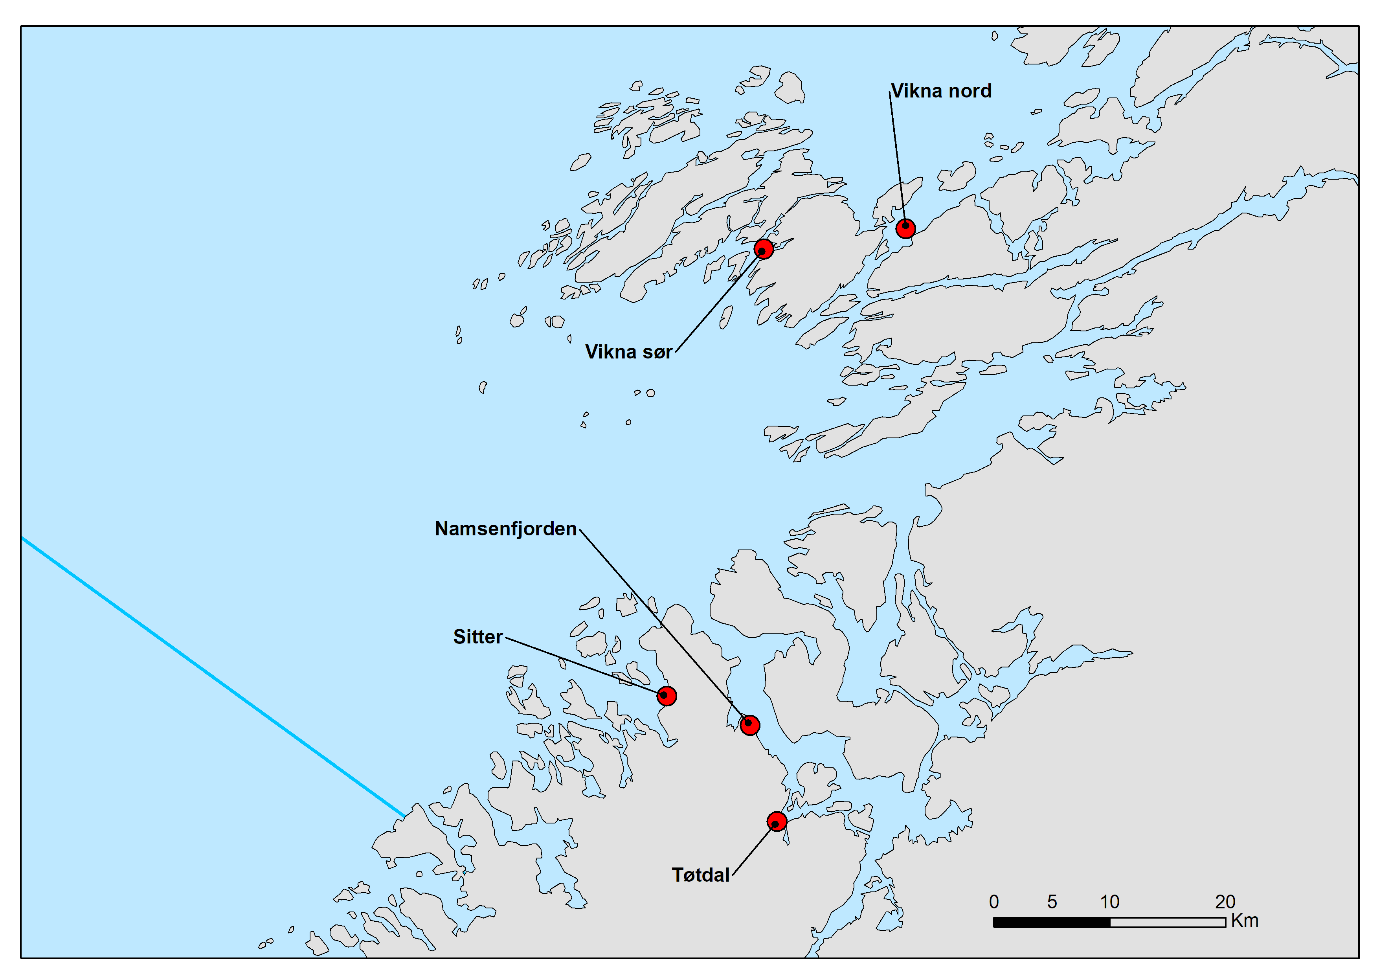
Figur 2.57. Stasjonene undersøkt ett eller flere år fra 2010 i NALO programmet.