Gå til hovedinnhold
Havforskningsinstituttet
HI
English
<- Tilbake
Søk
Søk
Søk
View page in English
Figur
Fra rapporten:
Fish diversity data from the Barents Sea Ecosystem Survey 2004-2019
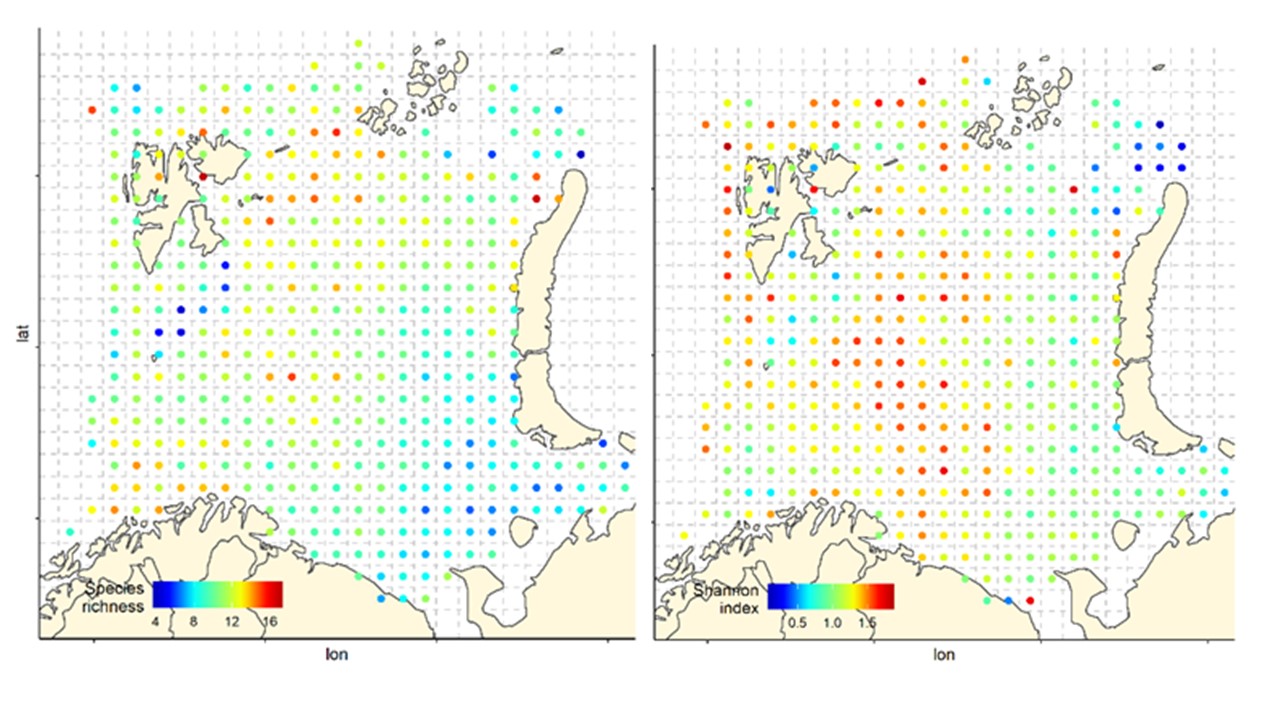
Figure 5. Average species richness (left) and the Shannon diversity (right) index by stations averaged for each 35 nm by 35 nm grid cell, all years combined. Note that the number of stations per grid cell varies greatly, see Figure 2.