Gå til hovedinnhold
Havforskningsinstituttet
HI
English
<- Tilbake
Søk
Søk
Søk
View page in English
Figur
Fra rapporten:
Lakselusinfestasjon på vill laksefisk langs Norskekysten i 2021
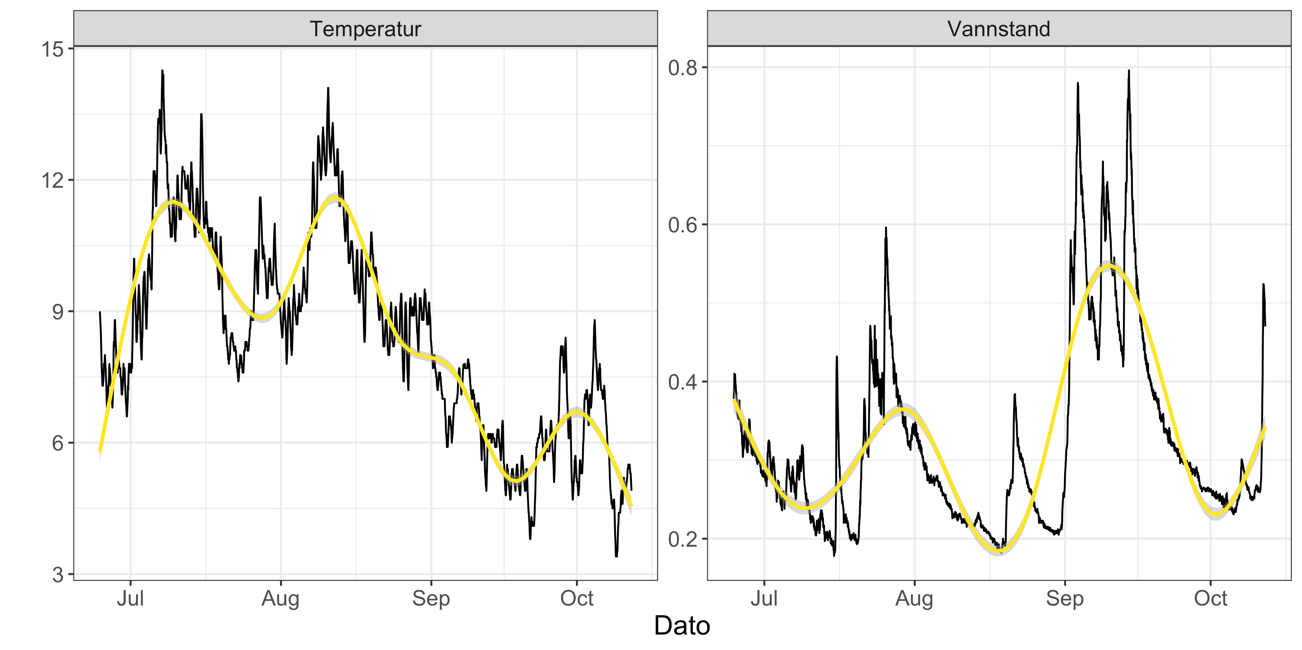
Figur 80. Variasjon i vannstand (m) og temperatur (C) i Rungaelva mellom 1. juli og 12. oktober.