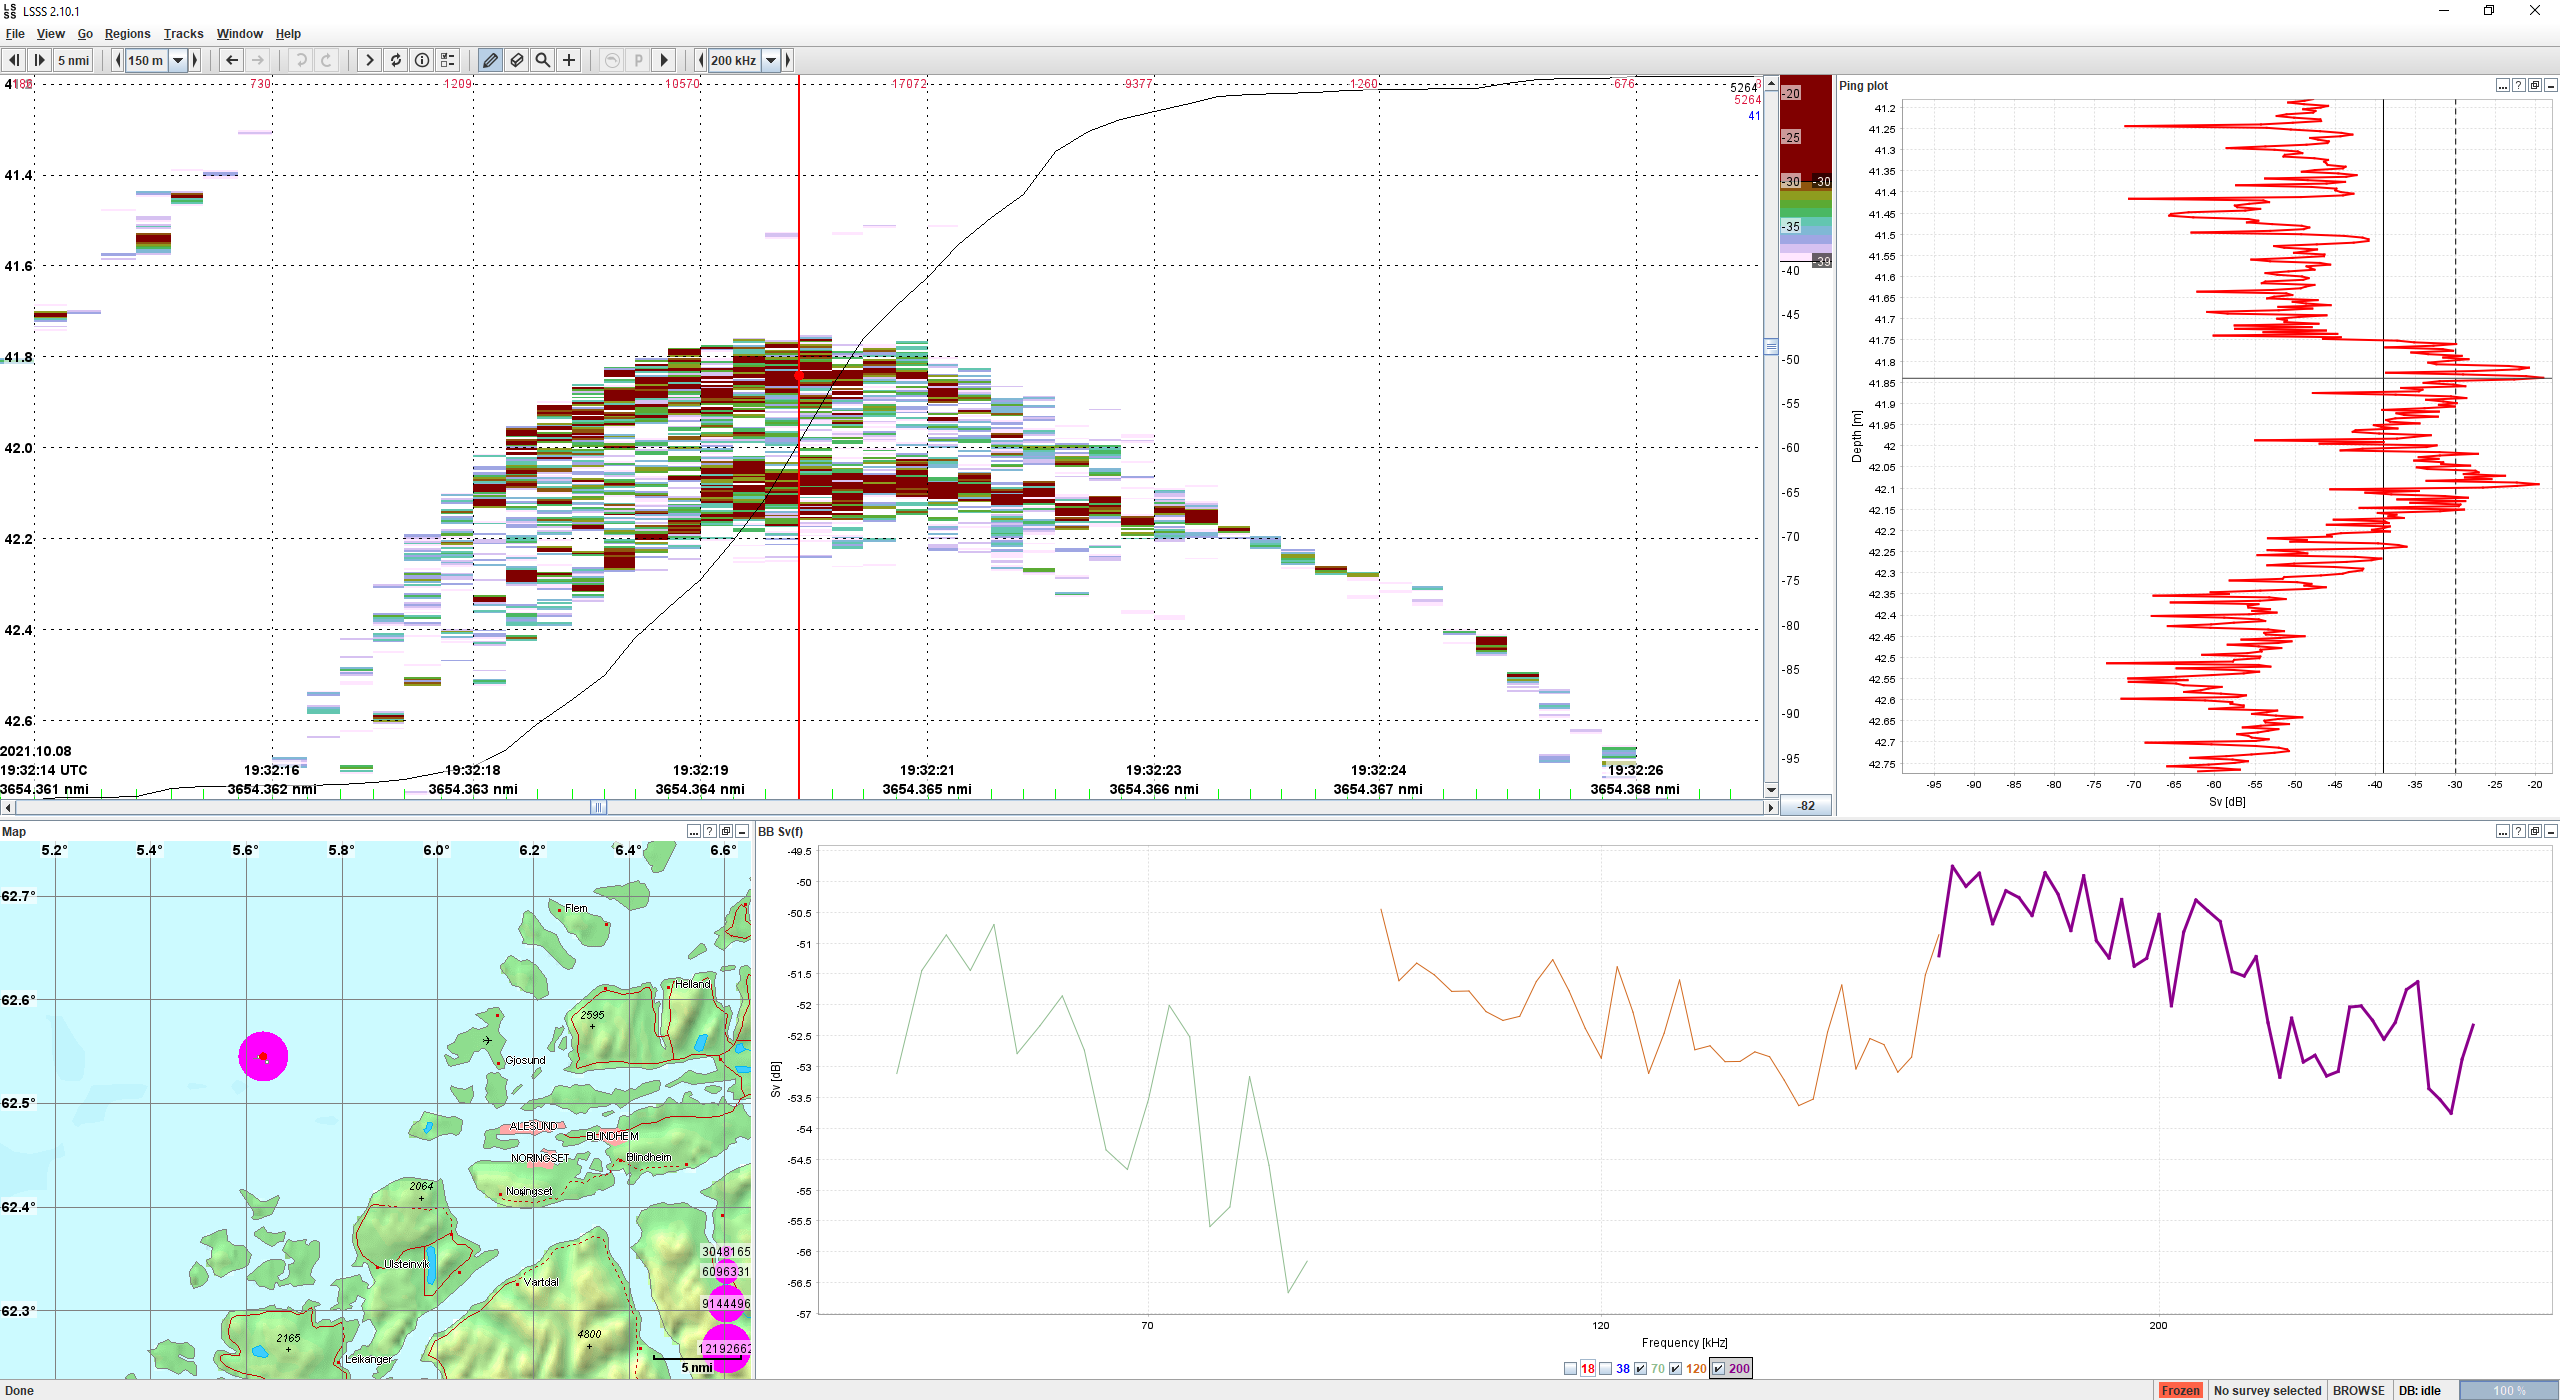
Figure 11 . 200 kHz echogram of a single bluefin tuna recorded, with stronger scattering from dorsal and ventral fish boundaries (upper left). Plot showing the echo strength (Sv) in a single ping (top right) and broadband frequency response from 70 to 200 kHz (bottom right).