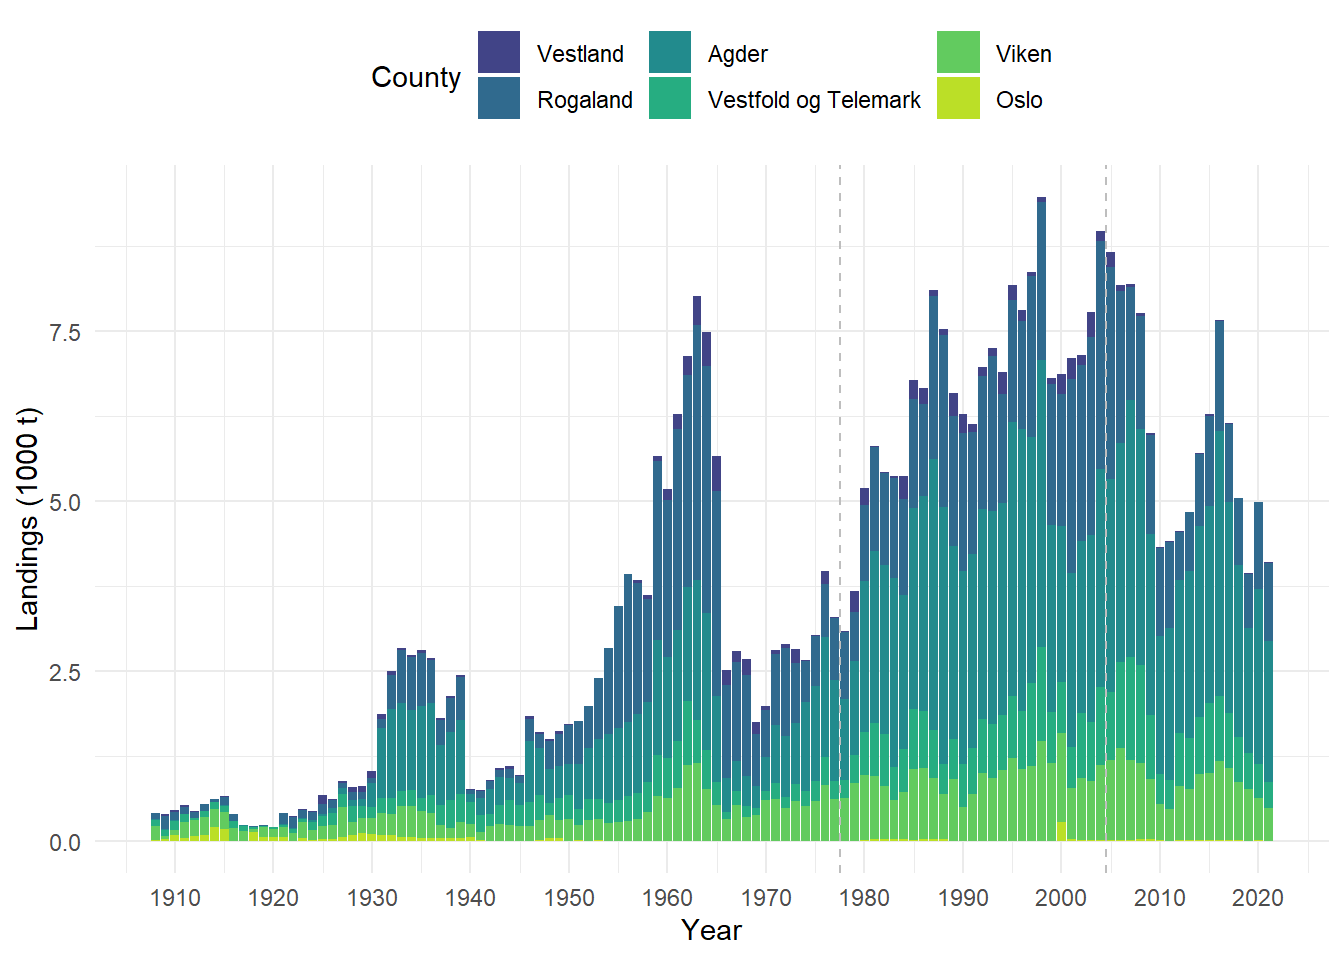
Figure 7. Total Norwegian landings (1000 t) per year and county in southwestern Norway (county borders since January 1, 2020), including landings from foreign vessels (mainly Swedish and Danish) into Norwegian ports. The data include landings from both Norwegian waters as well as waters of other countries. Vertical dashed lines indicate the different time series: historic landings data (1908-1976, SSB), aggregated (1977-2004) and detailed sales slips (2005-2021, Norwegian Directorate of Fisheries).