Gå til hovedinnhold
Havforskningsinstituttet
HI
English
<- Tilbake
Søk
Søk
Søk
View page in English
Figur
Fra rapporten:
Metoder for kartlegging av oppvekstområder for kystnære bestander av fisk
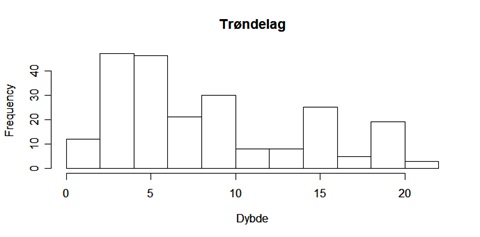
Figur 16: Fordeling av antallet videobservasjoner i ulike dyp i Trøndelag.