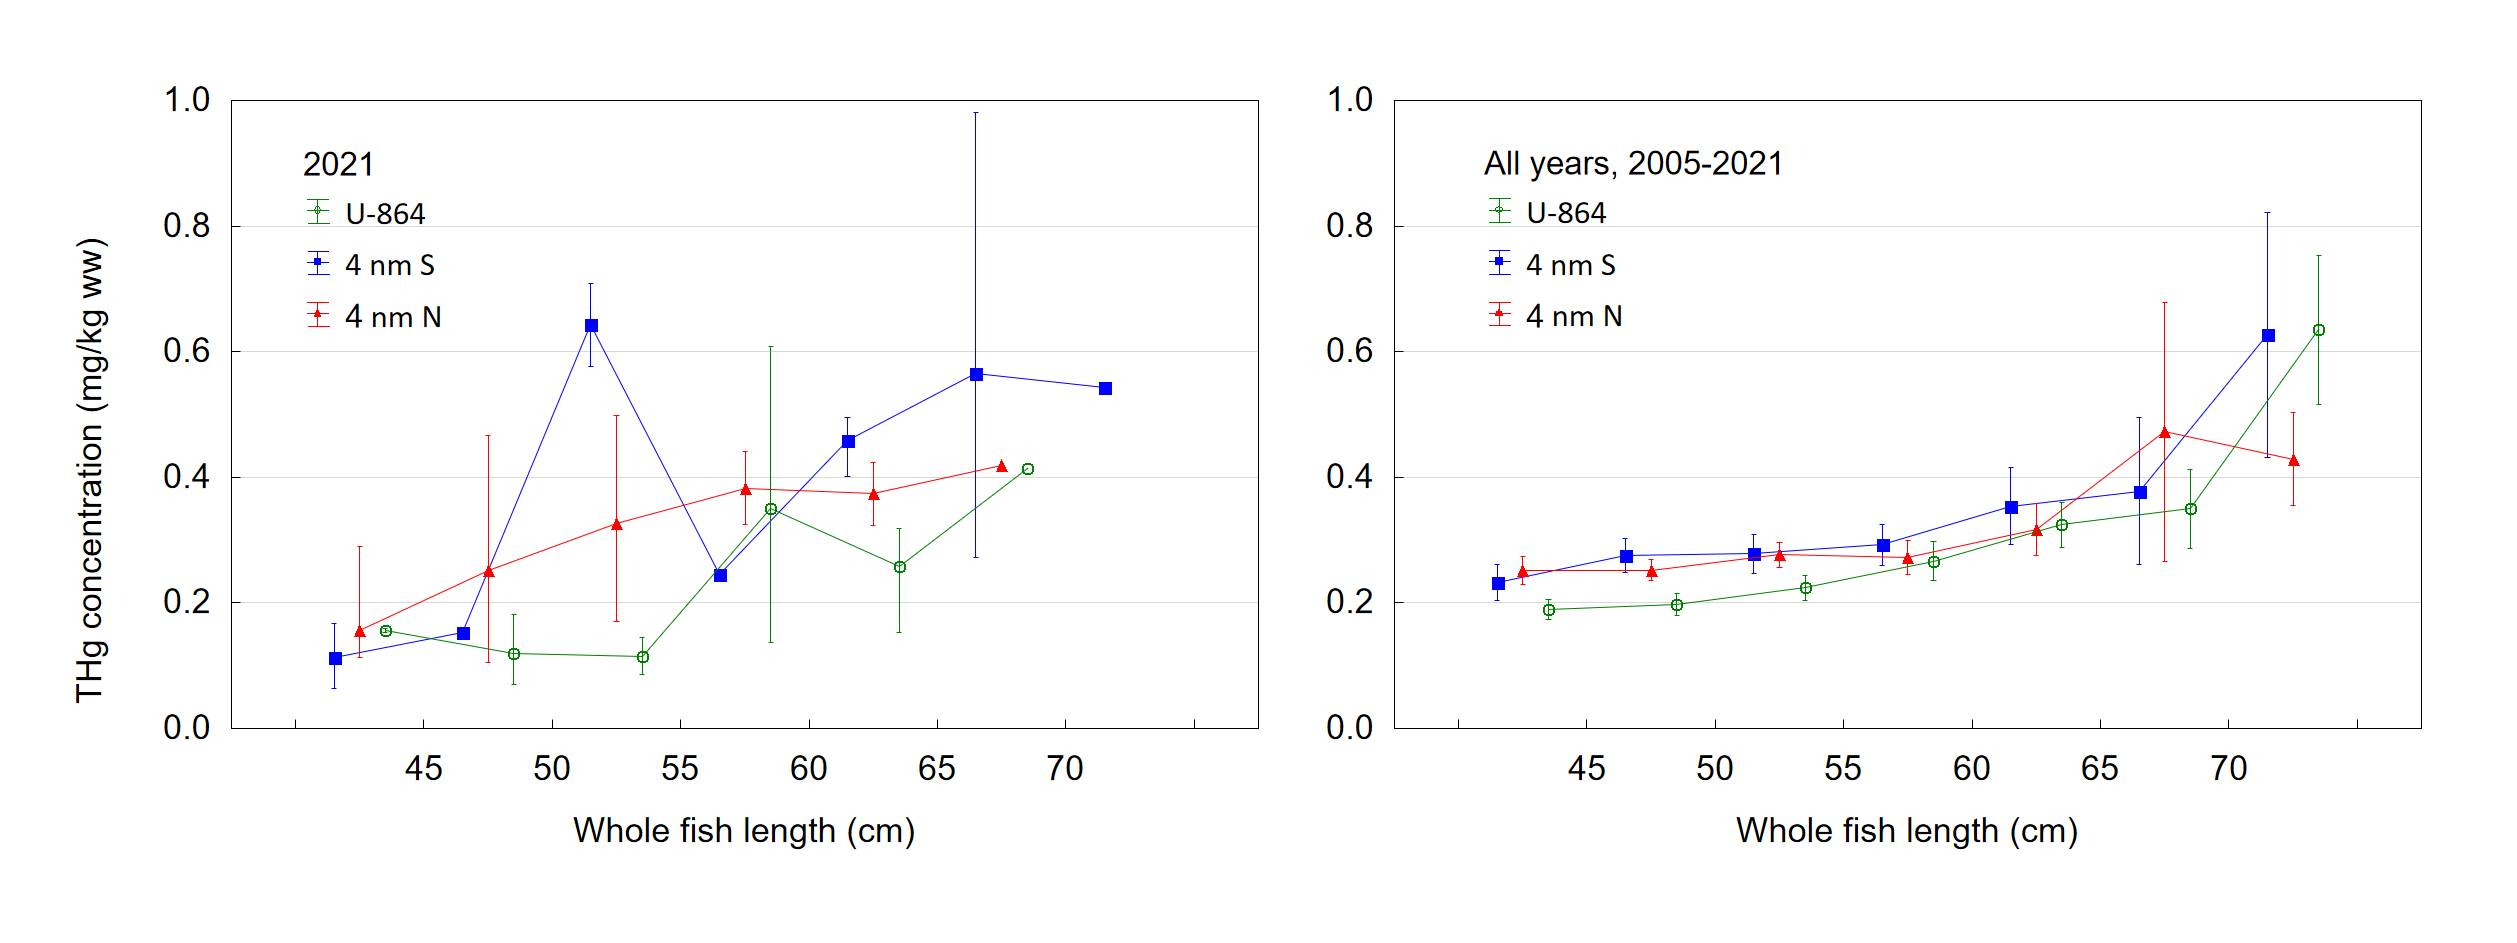
Figur 3. Total mercury concentration (THg, mg/kg ww) in fillet of tusk (Brosme brosme) at different length intervals (<45, 45-50, 50-55, 55-60, 60-65, 65-70 and >70 cm), caught at three different sites: at the wreck of U-864, four nautical miles south (4 nm S) and four nautical miles north (4 nm N) of U-864. Left: Year 2021 only, median, minimum and maximum values shown. Right: All years 2009-2021, means ± 95% confidence intervals are given.