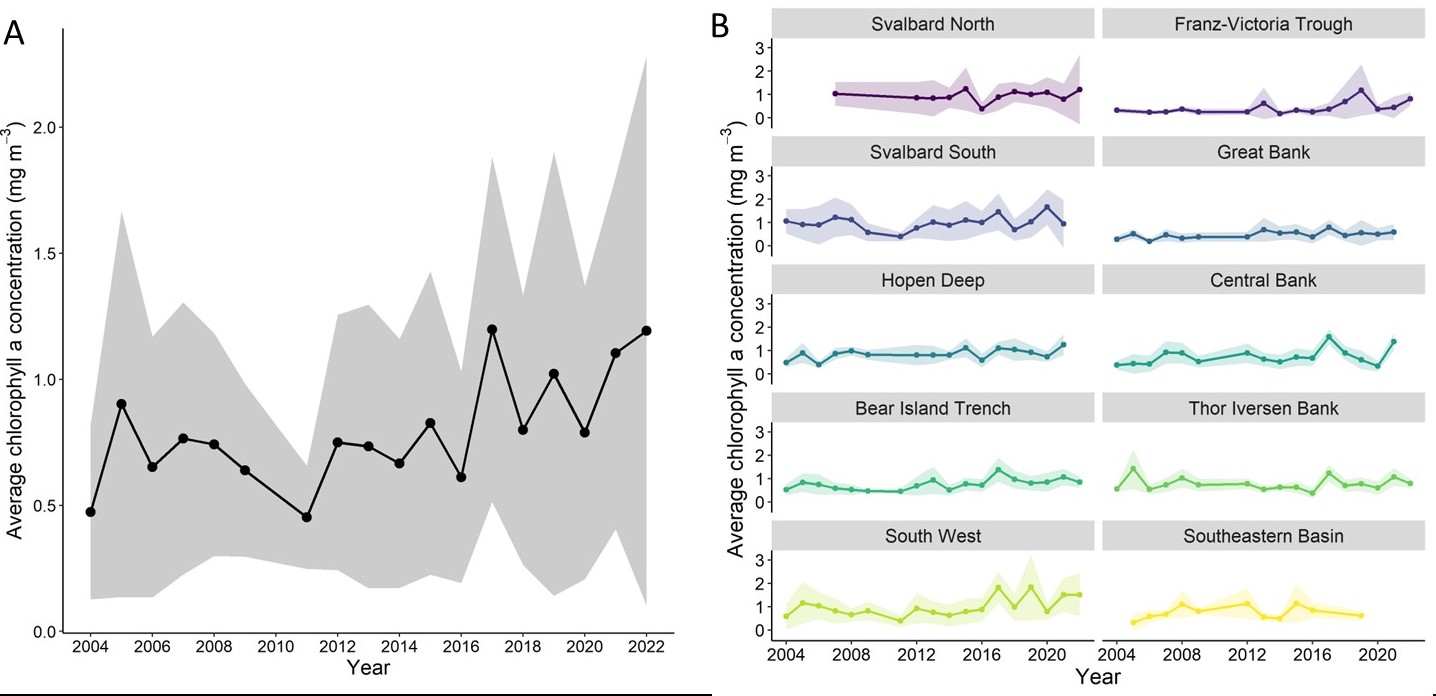
Figure 5.1.3. Timeseries of Barents Sea surface chlorophyll a concentration measured during the time period of the Ecosystem cruise, August-October. Shading indicates standard deviation. A) Average chlorophyll concentrations across the entire Barents Sea. B) Average chlorophyll concentrations in the subset of ICES sub-regions with relatively consistent temporal sampling. ICES sub-regions are roughly colored and arranged by sub-region location with more northern regions in darker colors at the top and southern in lighter colors at the bottom.