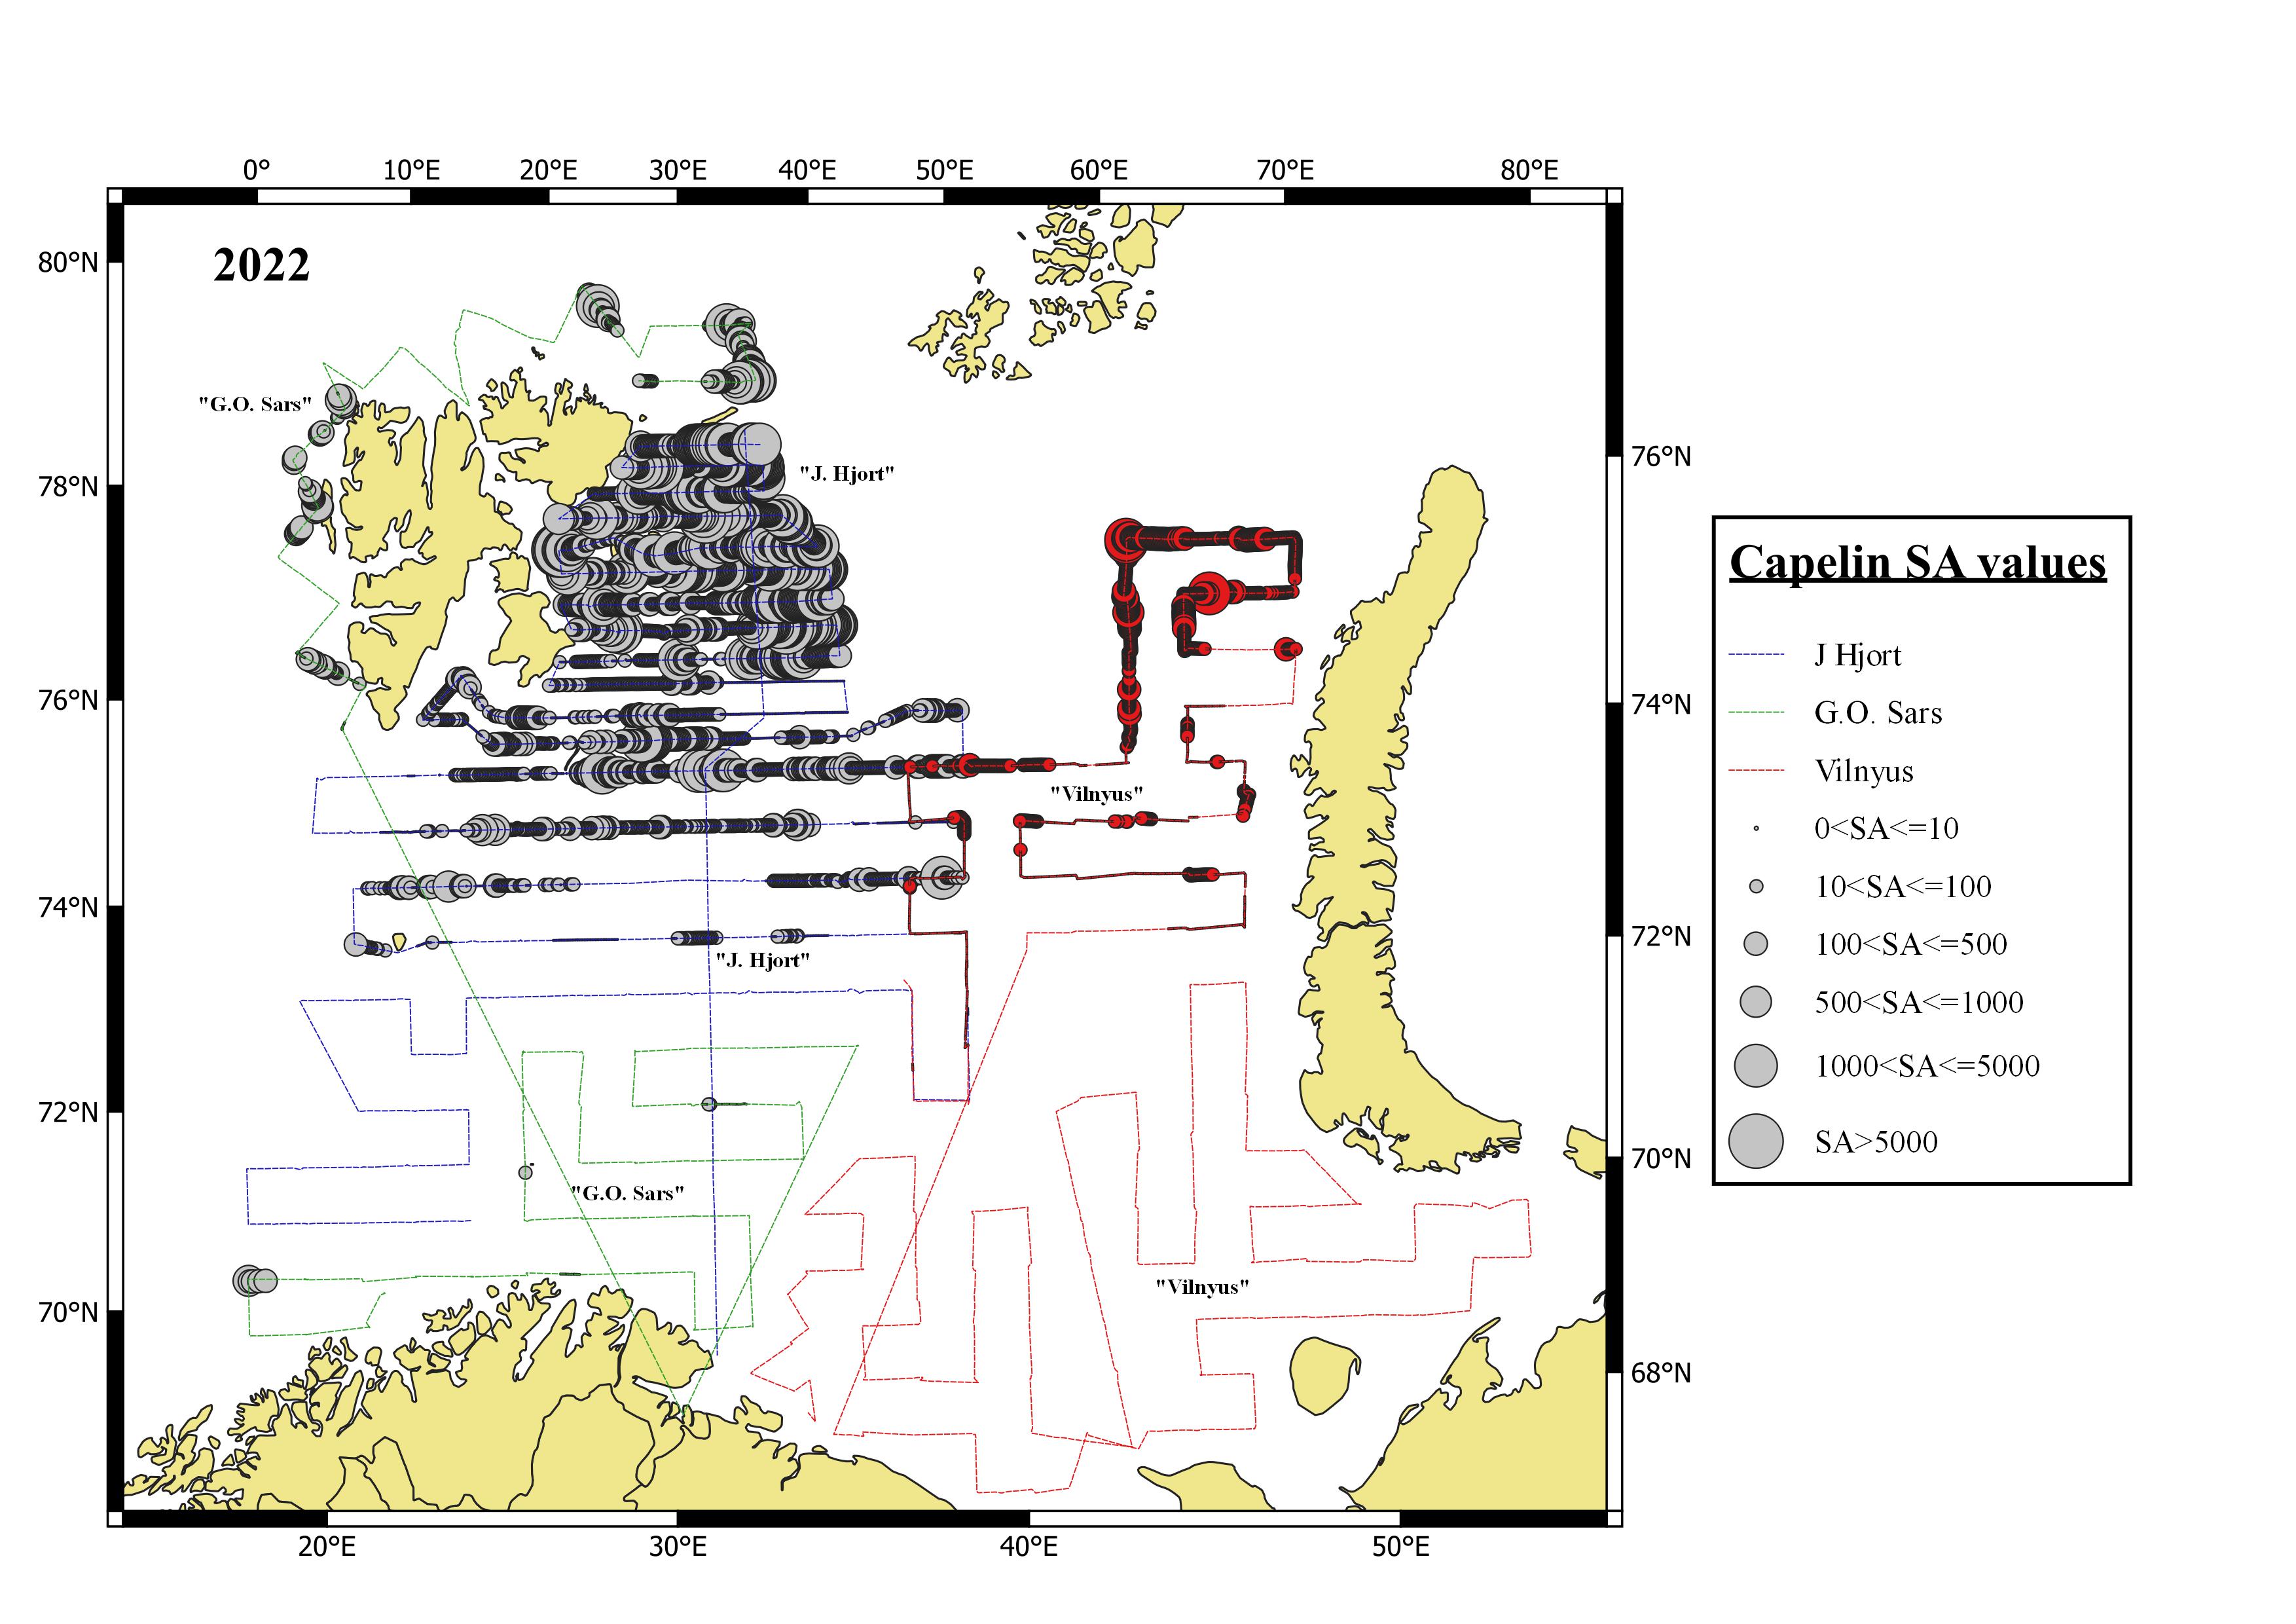
Figure. 7.1.1.1. Geographical distribution of capelin in autumn 2022 based on acoustic recordings. Circle sizes correspond to sA values (m2/nmi2) per nautical mile. The circles and transect marked with red colour are recordings from Vilnyus made later than the other vessels (see text for details).