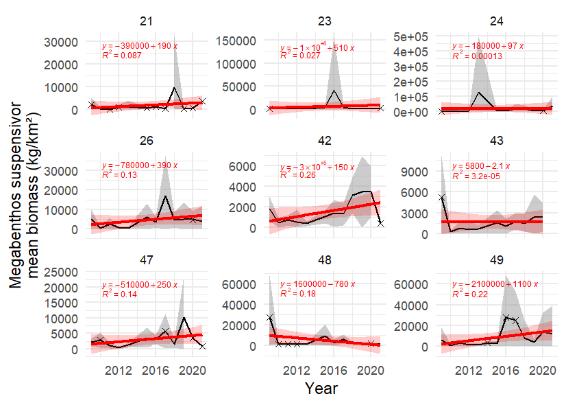
Figure A.5.1. The time series of estimated mean biomass of suspension feeding megabenthos shown with shaded areas indicating ± 1 SD. The red line represents fitted trend of degree 1 (with 95th confidence interval). Stars denote years with low sample size (< 5 trawls).