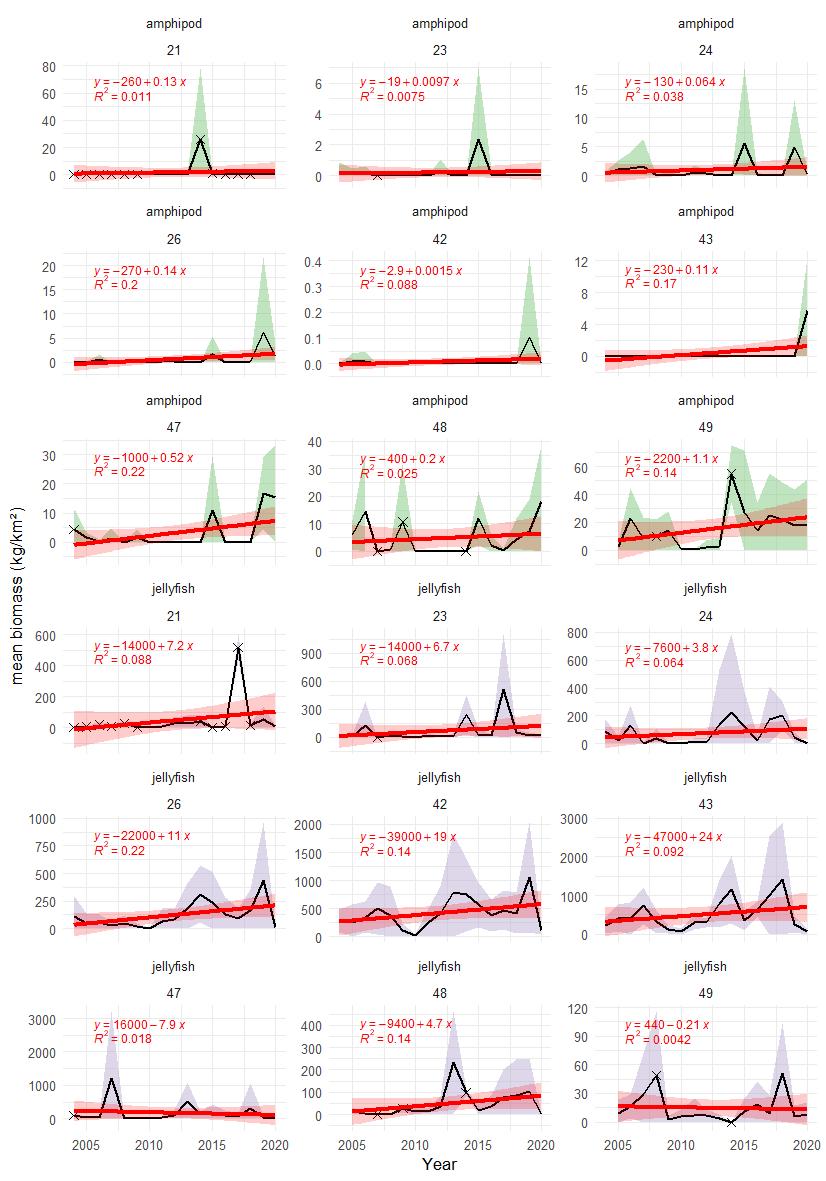
Figure A.4.2 Mean biomass (kg/km² wet wt.) of high trophic level zooplankton (amphipod and gelatinous zooplankton) in each polygon in the Arctic part of the Barents Sea shown with green (amphipod) and grey (jellyfish) shaded areas indicating ± 1 SD. Red line and shaded areas indicate fitted linear trend and 95% confidence bands, with equation and R² indicated in red. Stars denote years with low sample size (< 5 trawls).