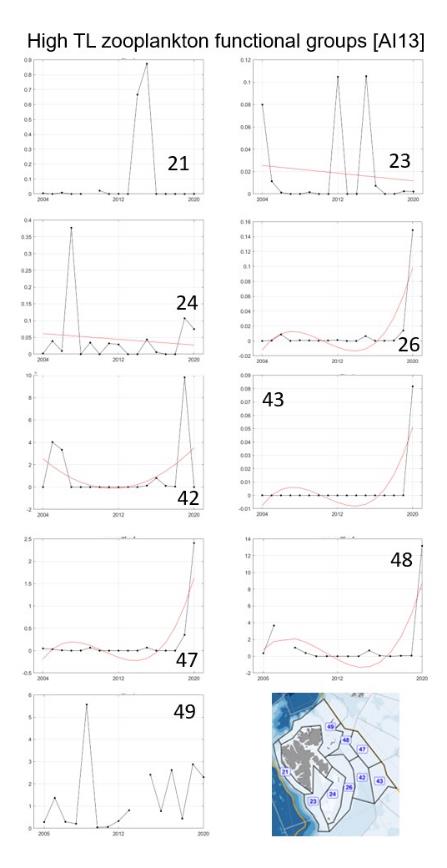
Figure A.13.5 Estimated ratio of biomass of pelagic amphipods (kg/km² wet wt.) to biomass of gelatinous zooplankton (kg/km² wet wt.) and fitted trend represented estimated by the best fitted trend approach by the red line in each polygon in the Arctic part of the Barents Sea.