Gå til hovedinnhold
Havforskningsinstituttet
HI
English
<- Tilbake
Søk
Søk
Søk
View page in English
Figur
Fra rapporten:
Panel-based Assessment of Ecosystem Condition of Norwegian Barents Sea Shelf Ecosystems - Appendices
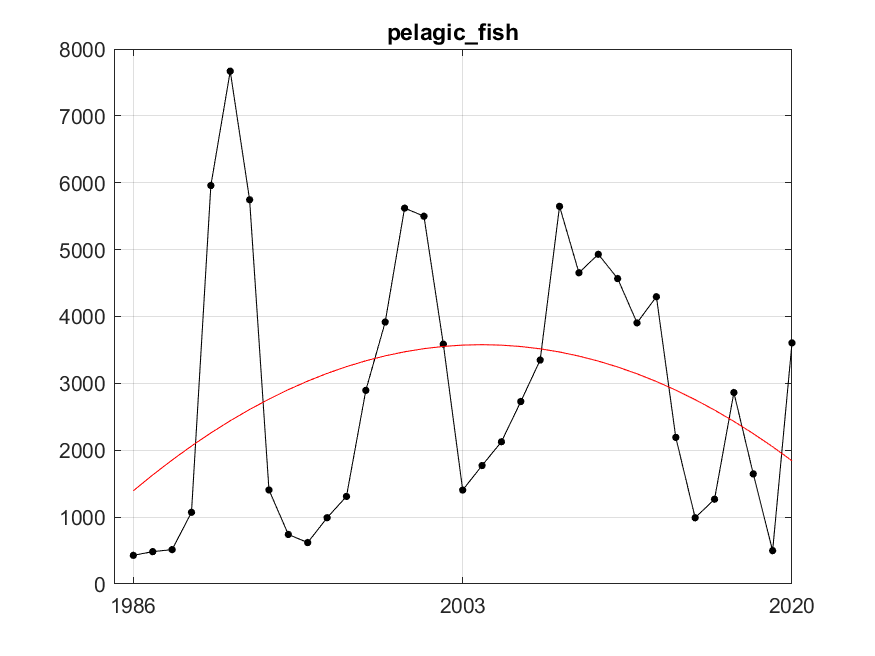
Figure A.7.1 The black dots and line are the indicator values of the sum of annual total stock biomass of capelin and polar cod. The red line represents fitted trend of degree 2 (quadratic). After fitting, residuals variance was 3549238.60, R²=0.59.