Gå til hovedinnhold
Havforskningsinstituttet
HI
English
<- Tilbake
Søk
Søk
Søk
View page in English
Figur
Fra rapporten:
Panel-based Assessment of Ecosystem Condition of Norwegian Barents Sea Shelf Ecosystems - Appendices
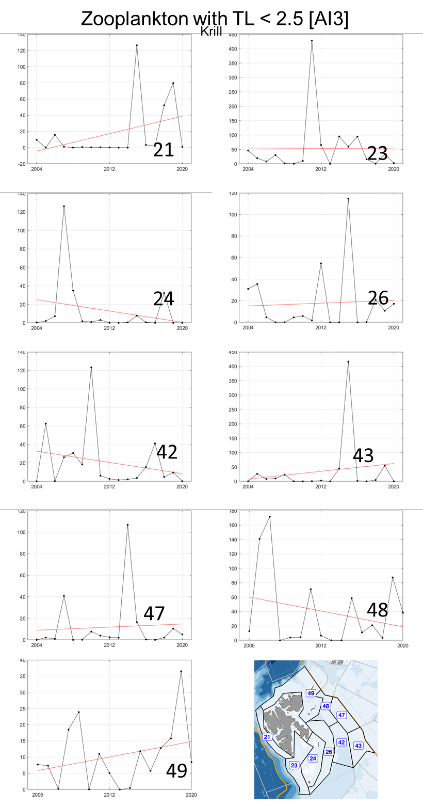
Figure A.3.4 Low trophic level krill biomass (Kg km-2 wet wt) in each polygon in the Arctic part of the Barents Sea (number on top of each panel) and fitted trend using the best fitted trend approach represented by the red line.