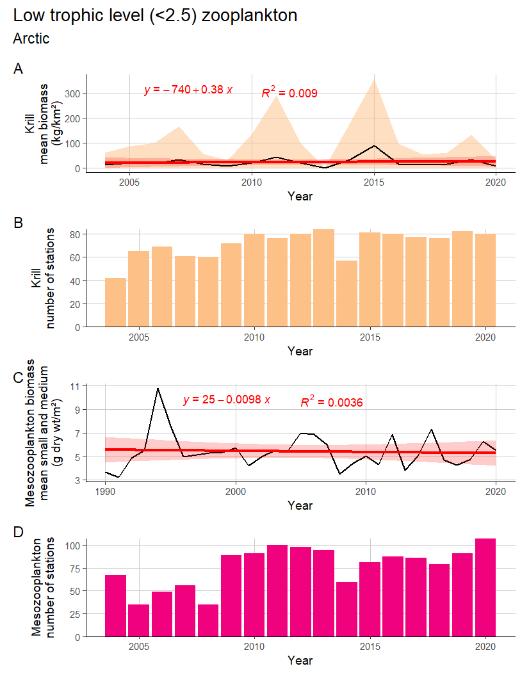
Figure A.3.1. The time series of estimated mean biomass of lower trophic level krill (Kg km-2 wet wt) (A) and mesozooplankton (g m-2 dry wt) (C) shown with light shaded areas indicating ± 1 SD only for krill. Red line and dark shaded areas indicate fitted linear trend and 95% confidence bands, with equation and R² indicated in red. Number of stations are indicated for krill (B) and small and medium mesozooplankton (D)