Gå til hovedinnhold
Havforskningsinstituttet
HI
English
<- Tilbake
Søk
Søk
Søk
View page in English
Figur
Fra rapporten:
Panel-based Assessment of Ecosystem Condition of Norwegian Barents Sea Shelf Ecosystems - Appendices
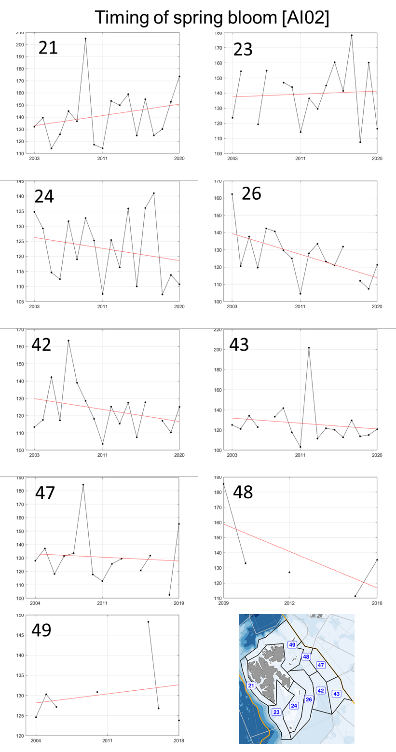
Figure A.2.4 Estimated start date of the spring bloom in each polygon in the Arctic part of the Barents Sea with red line indicating estimated trend using the best fitted trend approach.