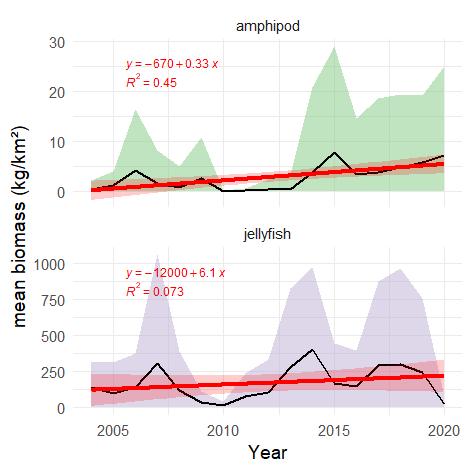
Figure A.4.1. The time series of estimated mean biomass of high trophic level zooplankton (pelagic amphipods and gelatinous zooplankton, (kg/km² wet wt.) shown with green (amphipod) and grey (jellyfish) shaded areas indicating ± 1 SD. Red line and red shaded areas indicate fitted linear trend and 95% confidence bands, with equation and R² indicated in red.