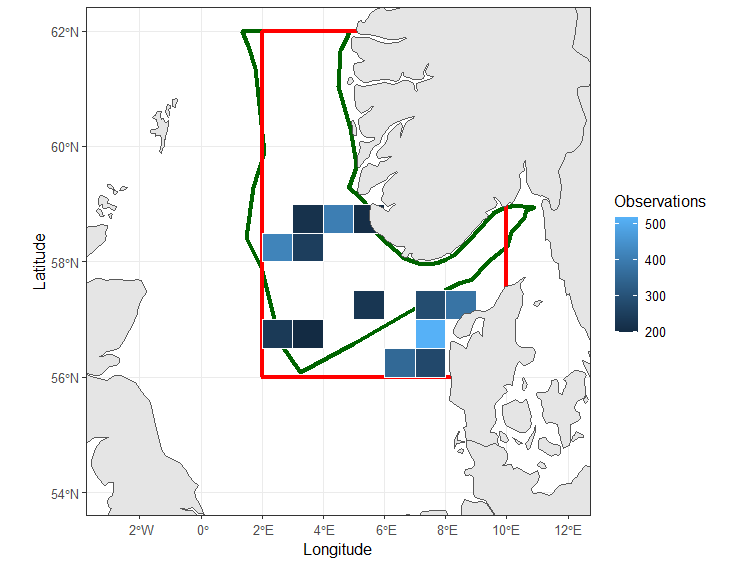
Figure 4.1. Locations of grid cells from which CPR data have been used for the assessment and number of data points for each cell. The PAEC area is indicated by the black line and the area from which data density was evaluated indicated by the red line.