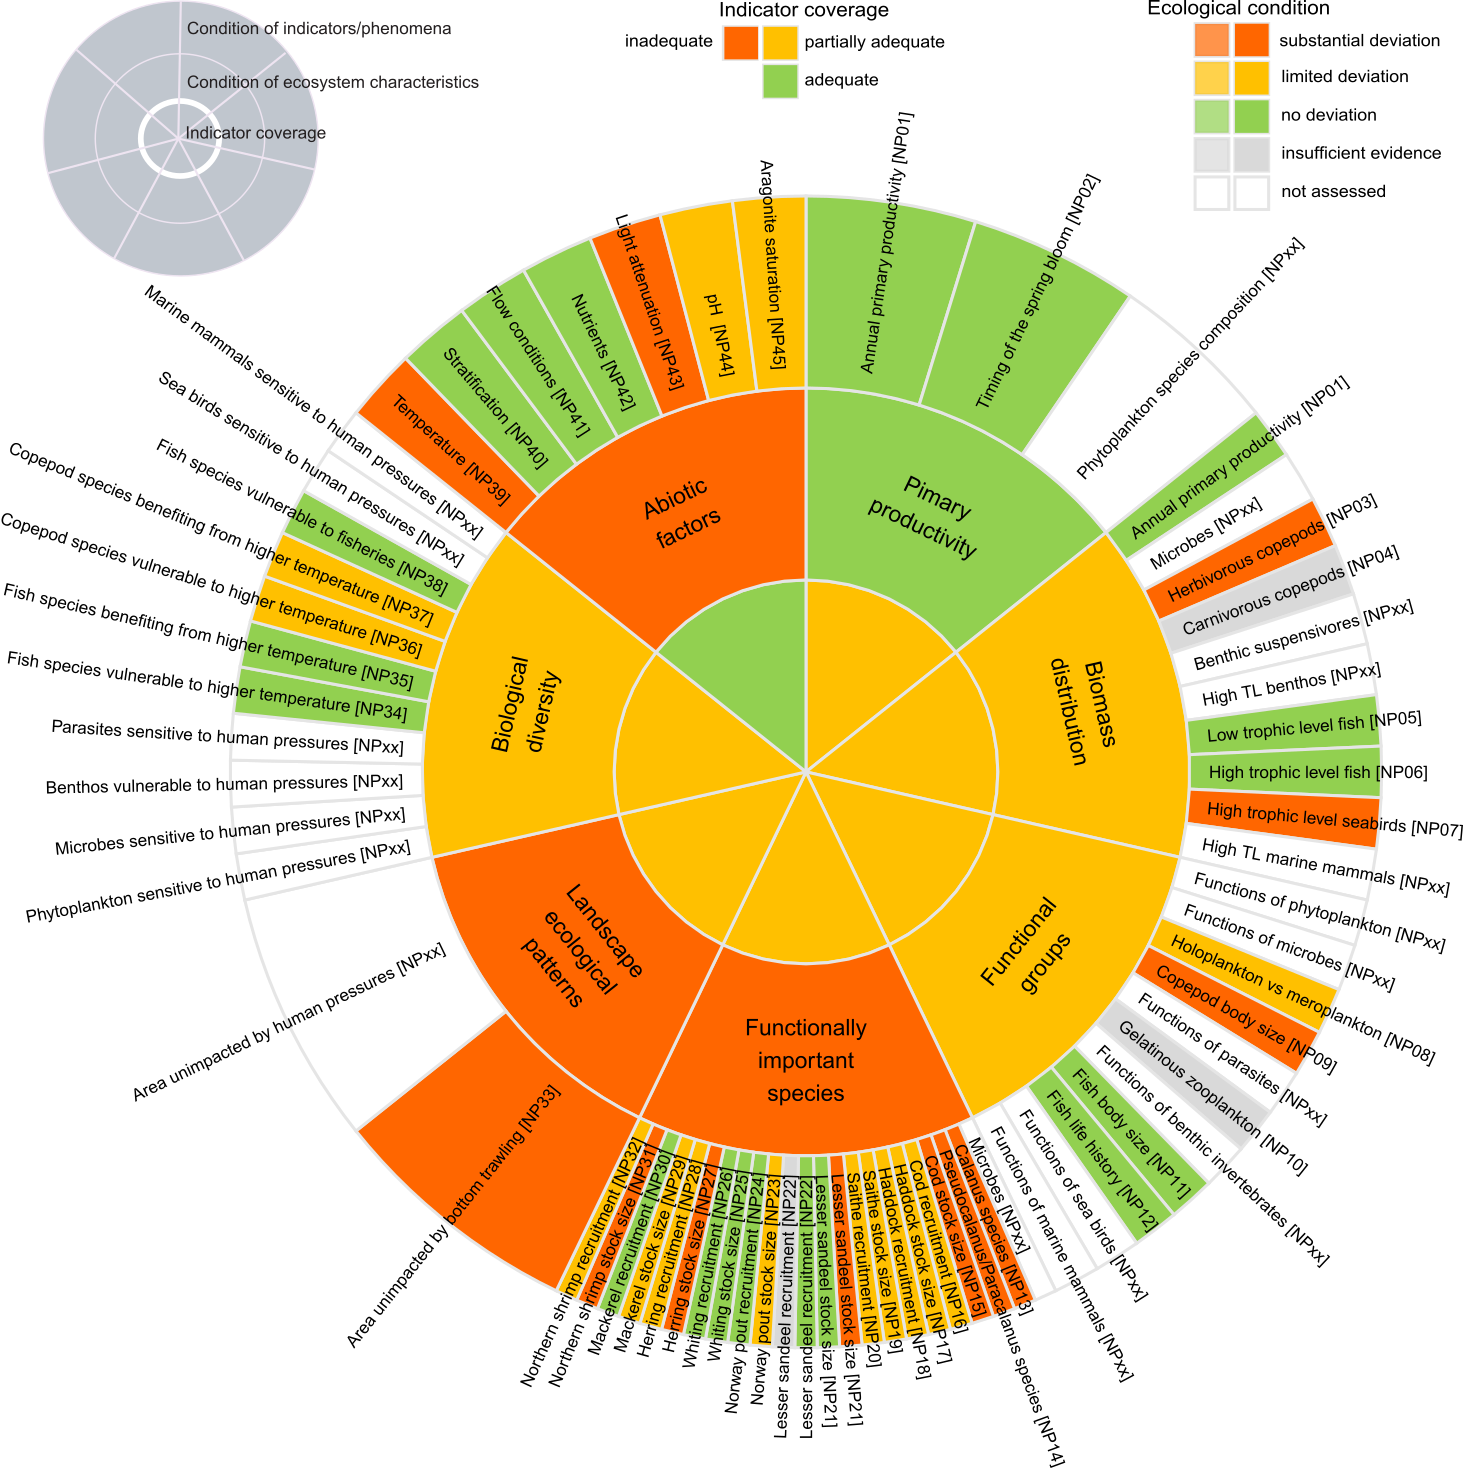
Figure 7.3.2. A graphical summary of the assessment of the Norwegian sector of the North Sea shelf ecosystem. The outer circle shows the assessment of ecological condition at the level of the individual indicators with associated phenomena ID in square brackets. Indicators which have been recommended for inclusion (Table 7.3. 2), but not included in the current assessment are shown in white to illustrate the perceived most important deficiencies in the current indicator set. The two innermost circles show the assessment at the level of ecosystem characteristics, in the form of ecological condition (middle circle) and indicator coverage (innermost circle), based on the set of indicators included in the assessment. TL: trophic level.