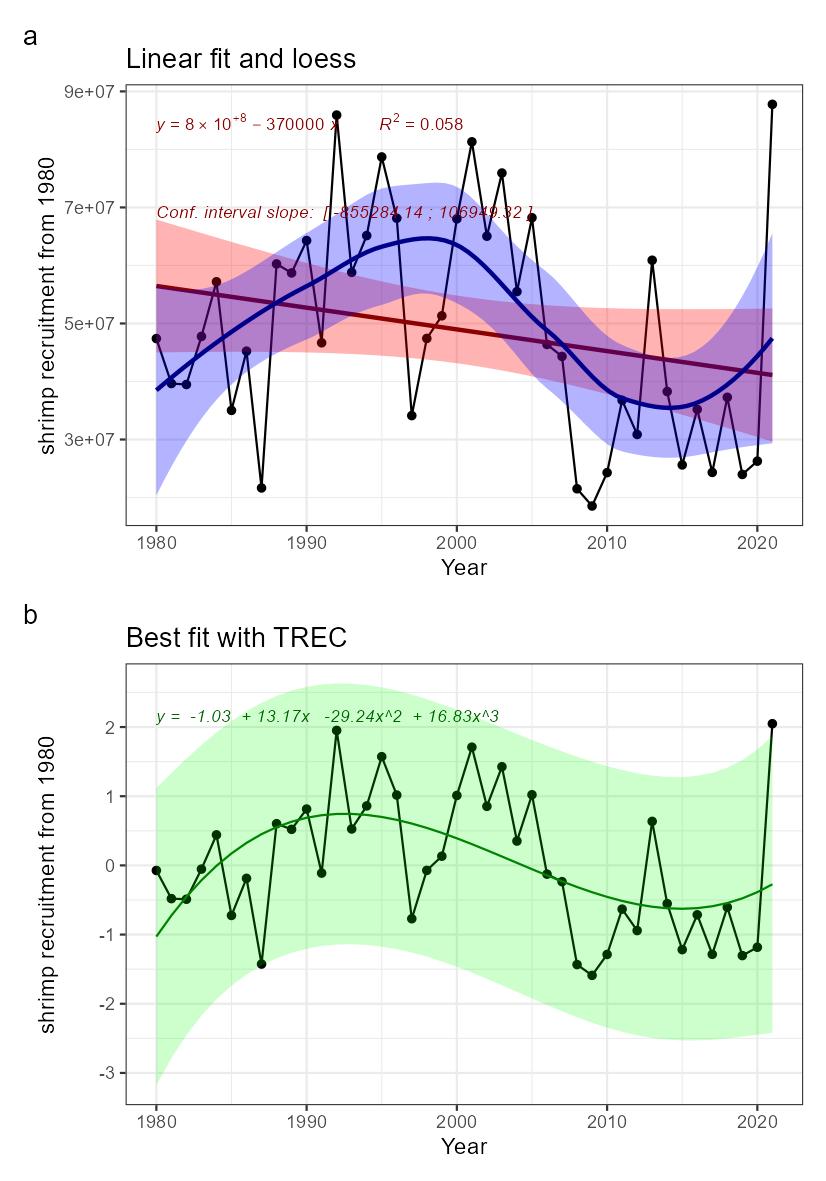
Fig. 32.2: Indicator time series and fitted trends. a) linear trend fitted with Least-square method (not adapted for short time series) in red, and loess in blue, for information. b) Best fitted trend using the first steps of a TREC analysis on standardized time series