Gå til hovedinnhold
Havforskningsinstituttet
HI
English
<- Tilbake
Søk
Søk
Søk
View page in English
Figur
Fra rapporten:
Panel-based Assessment of Ecosystem Condition of the North Sea Shelf Ecosystem - Appendices
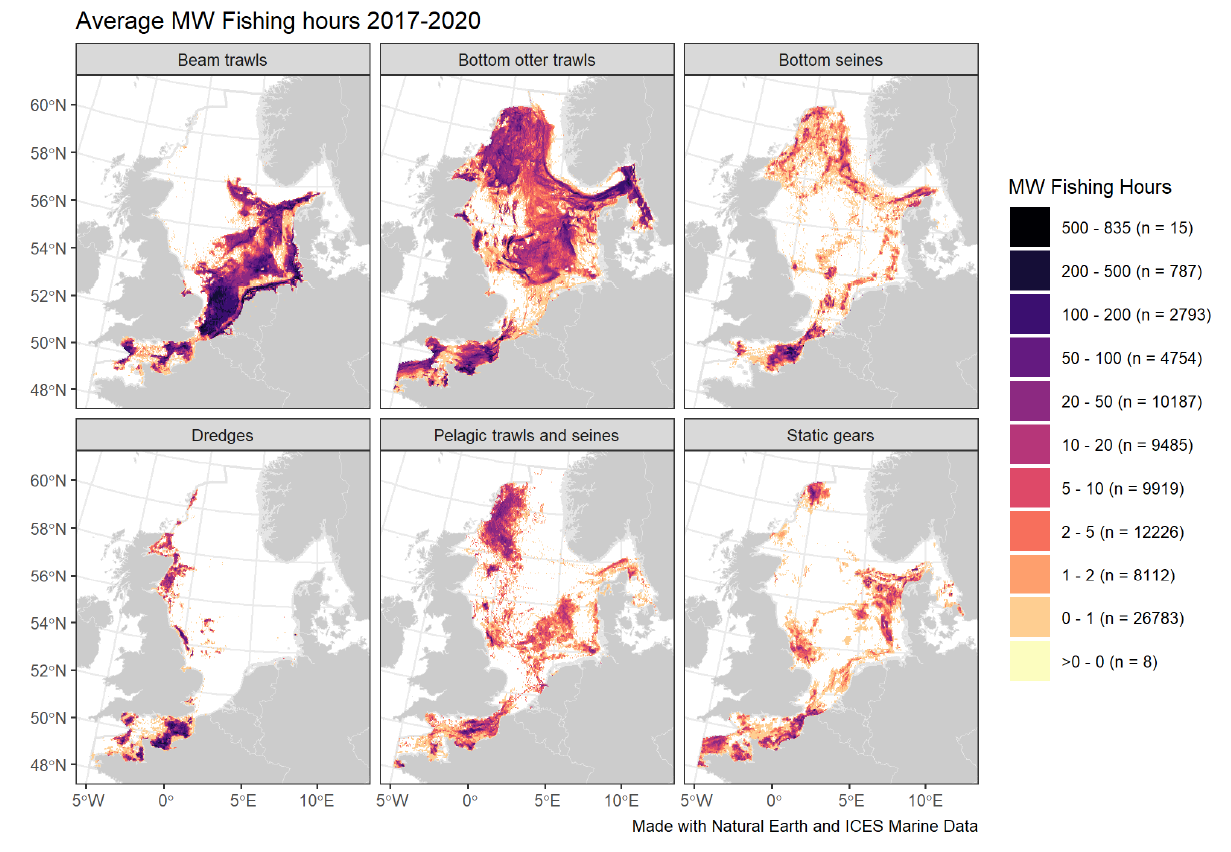
Figure 33. Spatial distribution of average annual fishing effort (MW fishing hours) in the Greater North Sea, by gear type. Fishing effort data are only shown for vessels >12 m with vessel monitoring systems (VMS). Source ICES (2021b).