Gå til hovedinnhold
Havforskningsinstituttet
HI
English
<- Tilbake
Søk
Søk
Søk
View page in English
Figur
Fra rapporten:
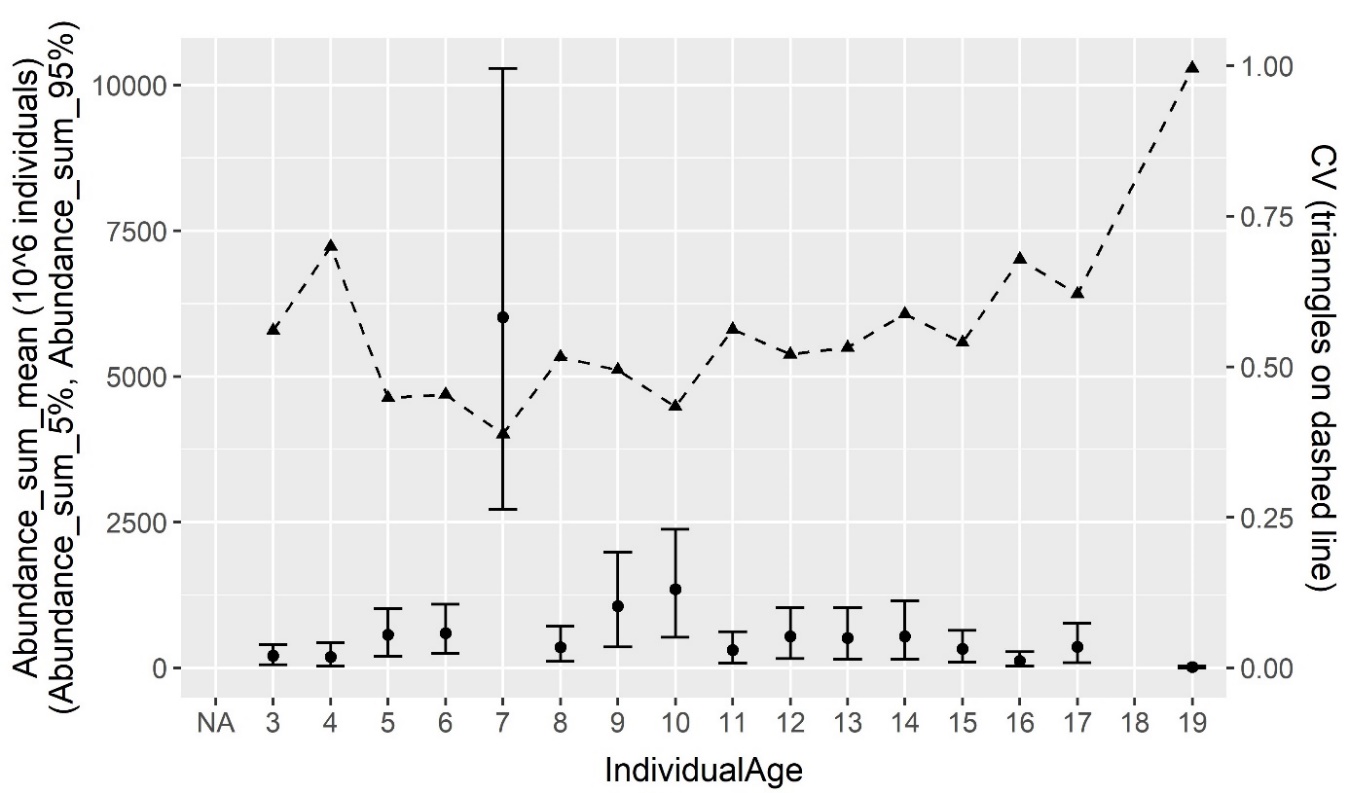
Distribution and abundance of Norwegian spring-spawning herring during the spawning season in 2023
Figure 5. Abundance estimates (left axis) and relative standard error (right axis) by age. Black dots are mean of 1000 boostrap replicates in Stox, error bars represent 90 % confidence intervals and triangles relative standard error (CV).