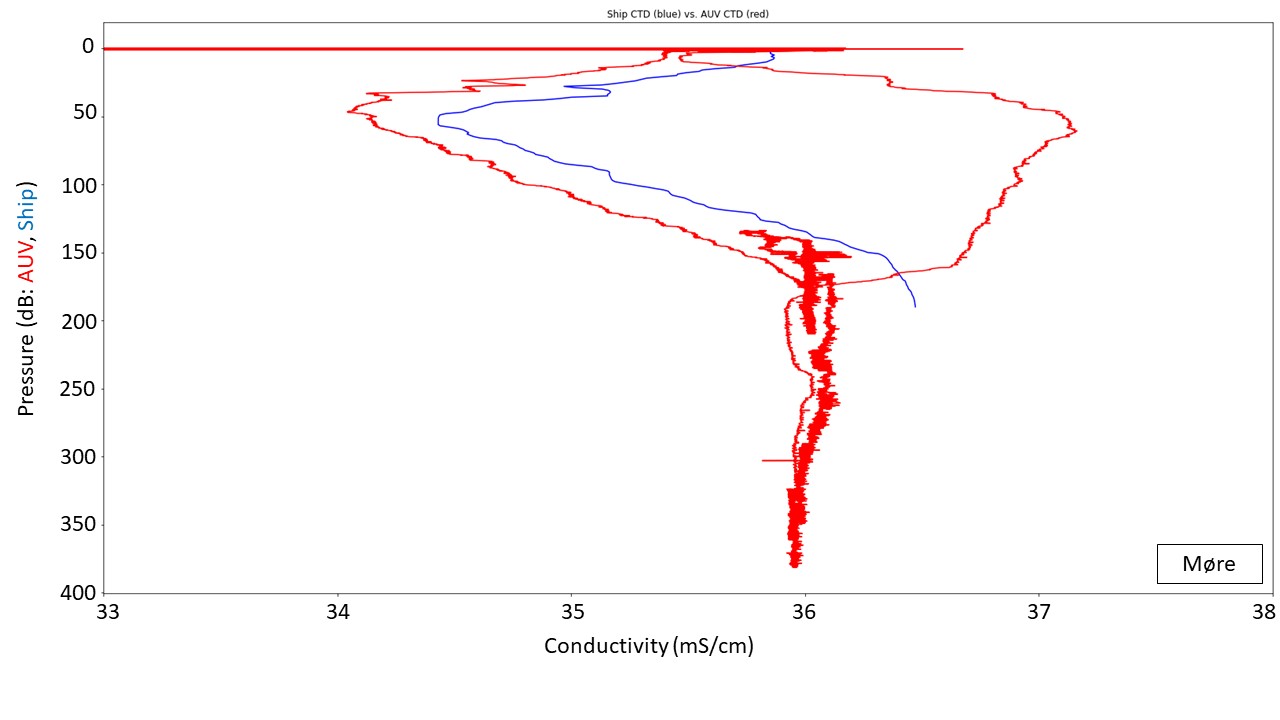
Comparison between shipborne and AUV conductivity. The shipborne CTD was taken on the shelf where the AUV was deployed. The ship CTD uses S/m units of conductivity – these have been multiplied with 10 to match the units from the AUV. Very apparent is an offset between the ship and AUV conductivity of about 1%. On the shelf, the profiles otherwise show a good correspondence. The shipborne CTD shows only downcast, while the AUV CT show both down- and upcast. The water properties are notably different on and off the shelf.