Gå til hovedinnhold
Havforskningsinstituttet
HI
English
<- Tilbake
Søk
Søk
Søk
View page in English
Figur
Fra rapporten:
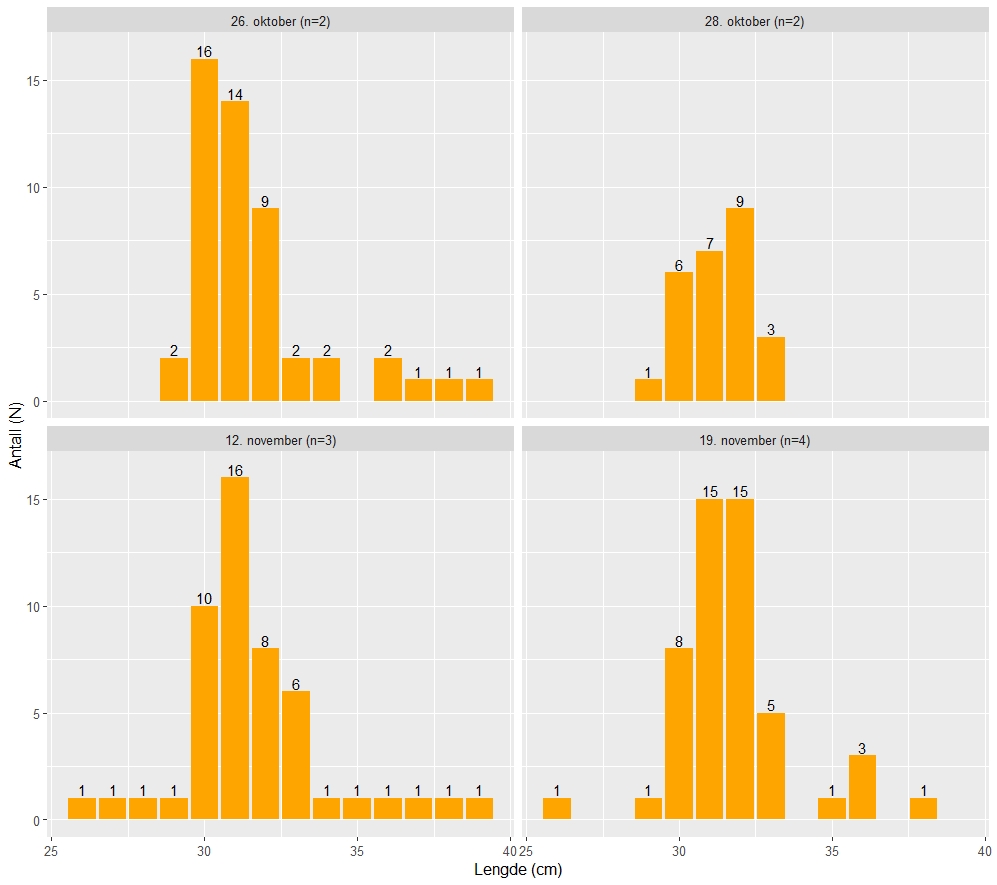
Test av snurrevad til fiske etter makrell
Figur 4. Lengdefordelingen av makrell pr dag (N=antall fisk, n=antall kast pr dag).