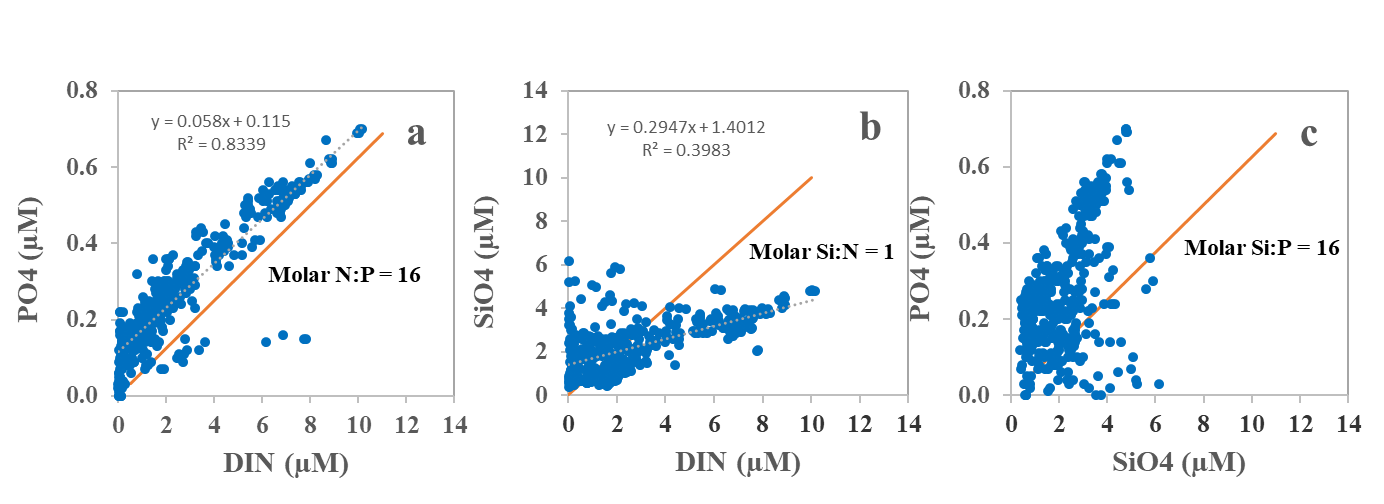
Figure 11. Dissolved inorganic nutrients measured in surface waters (0-10 m depth). Phosphate (a) and silicate (b) were plotted as a function of dissolved, combined nitrogen (DIN= NO2+NO3), and phosphate (c) was plotted as a function of silicate. Whole line shows the Redfield N:P relationship and other molar relationships (N:Si, Si:P), necessary for a balanced cellular synthesis and growth in phytoplankton.