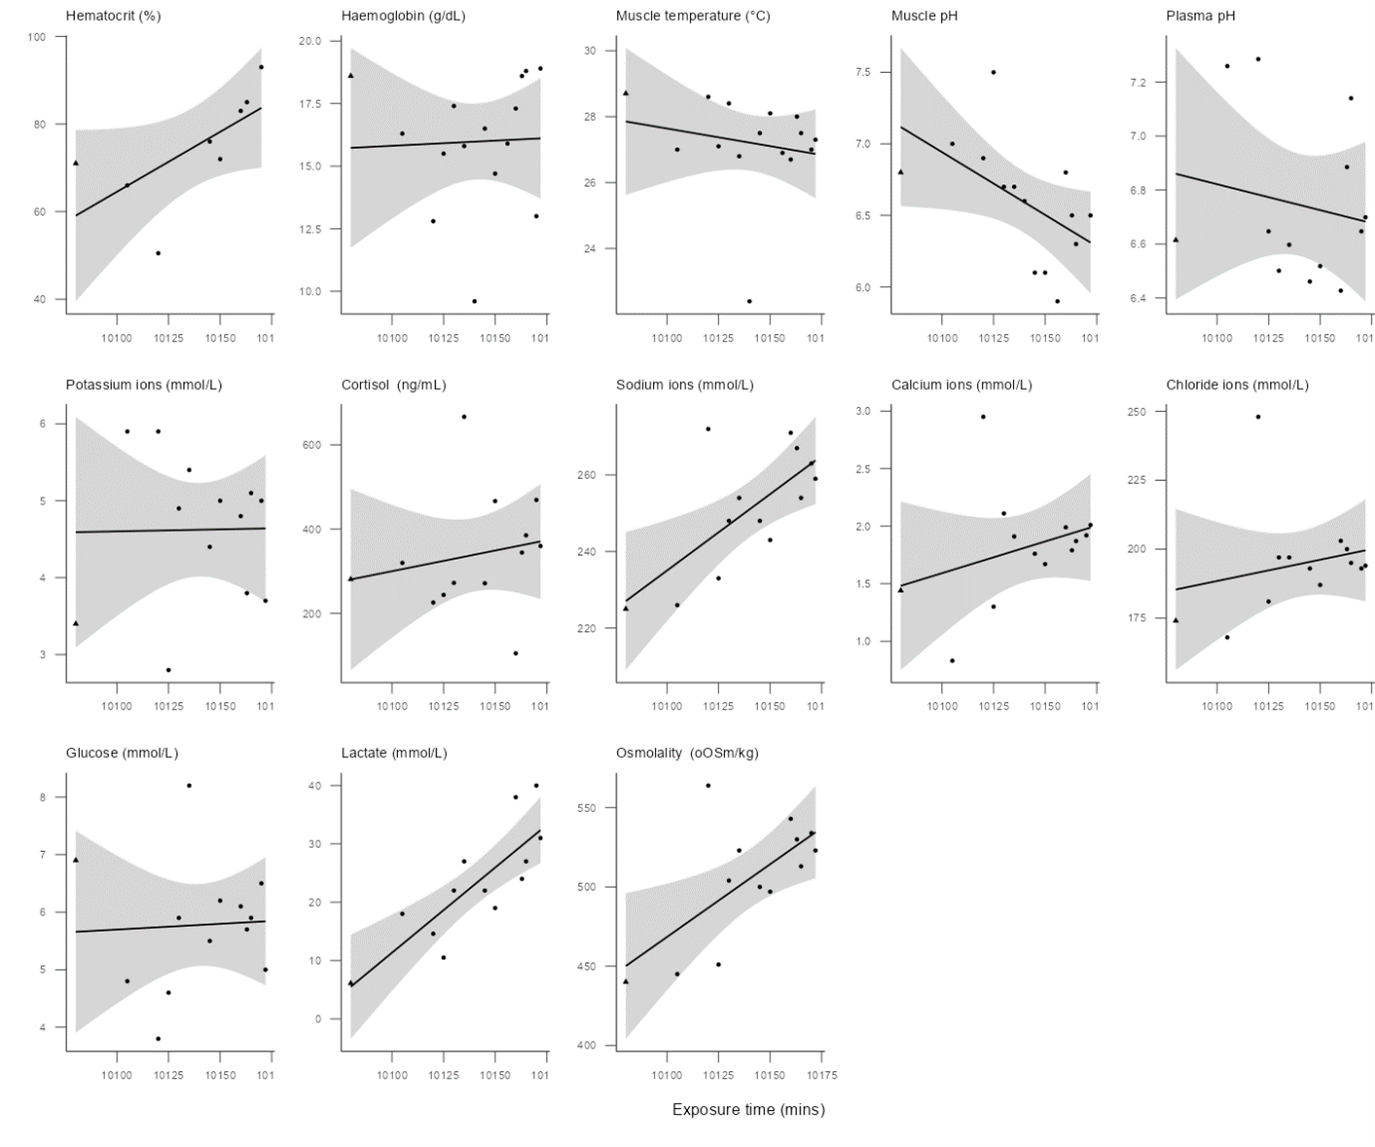
Figure 16: Physiological responses over time during slaughter of live-stored bluefin tuna. Fish were caught by purse seine, transferred to a transfer cage, towed for ~1 day and then slaughtered by “drying” the cage (Cast 2). Black lines and shaded areas represent a linear model fit with 95% confidence intervals. Black points indicate raw data, with triangles for fish that were electrically stunned during the slaughter process. Exposure time = 0 is when the first fish was slaughtered.